Data &
Technology
Research
Reports
Report Solutions
Reports Library
Actionable
Strategies
Free
Resources
Simple Backtest Calculator
Simple Seasonality Calculator
The Kelly Criterion Calculator
Sentiment Geo Map
Public Research Reports
Free Webinar
Pricing
Company
About
Meet Our Team
In the News
Testimonials
Client Success Stories
Contact
Log inLoginSign up
< BACK TO ALL REPORTS

Testing Oversold Small-Caps

Jason Goepfert
2017-08-25
null

With the introduction of our backtesting engine, it's now possible to determine how a market (or almost any market) has responded to various conditions from our indicators.

Let's go over a use case with the small-cap Russell 2000 ETF, IWM.

From the Dashboard, if we click on the Optix Heatmap and then reorganize it by the 20-day average of the Optimism Index, we can see that IWM is among the most hated of all markets over the past month.

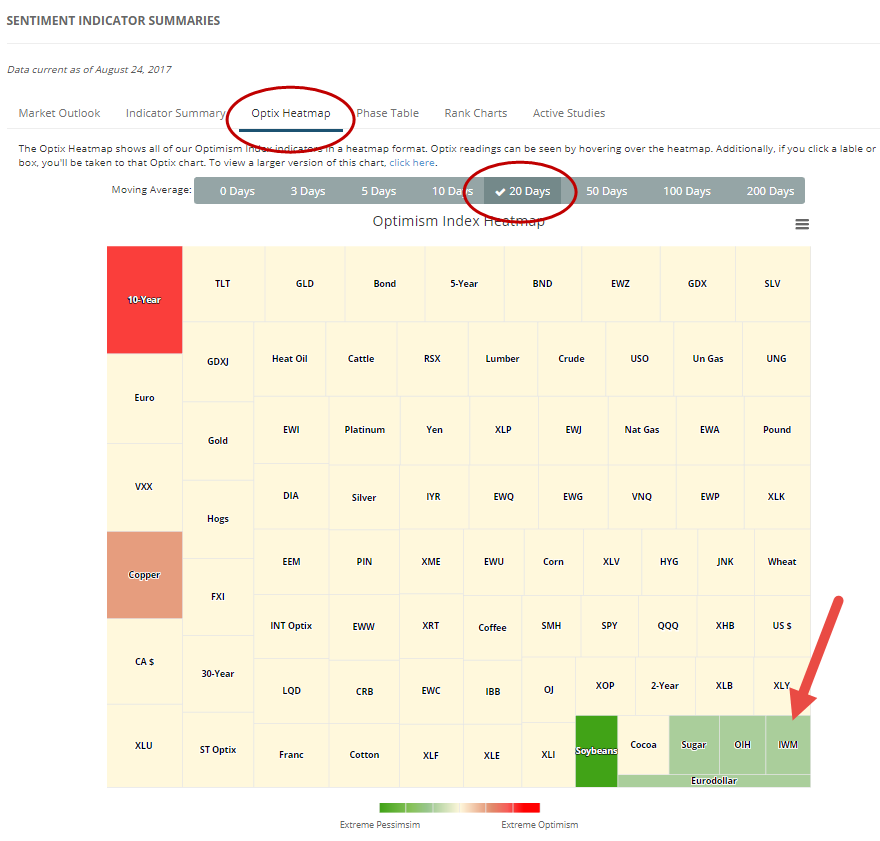
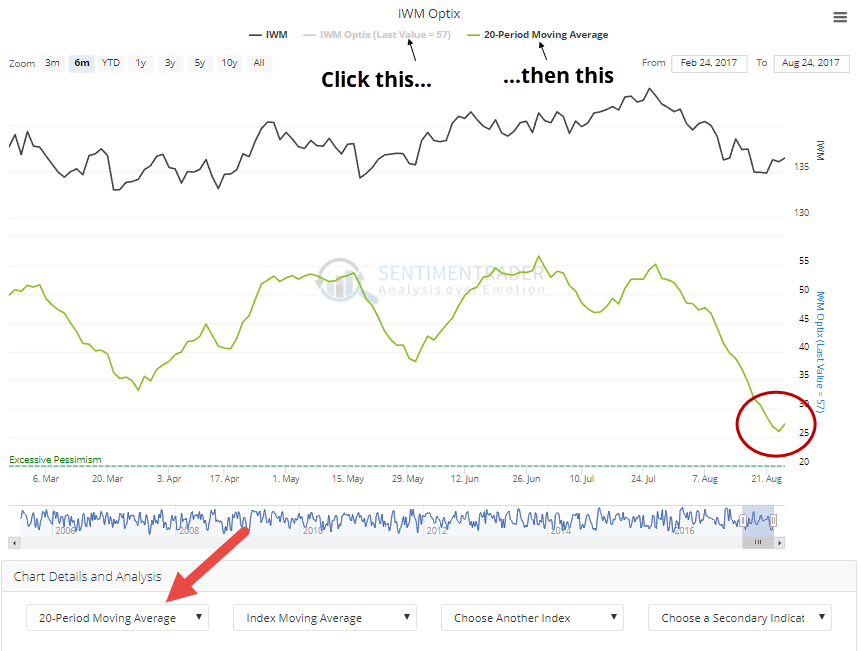
If you click that IWM tile, it will bring up the chart of the Optimism Index for IWM. From the drop-down box below the chart, choose the 20-day average and it will show up on the chart. To isolate it, in the legend click IWM Optix, which will make everything disappear. Again in the legend, click 20-Period Moving Average and only the moving average will now appear in the chart. We can see that it's just curling up from a low level of around 26.

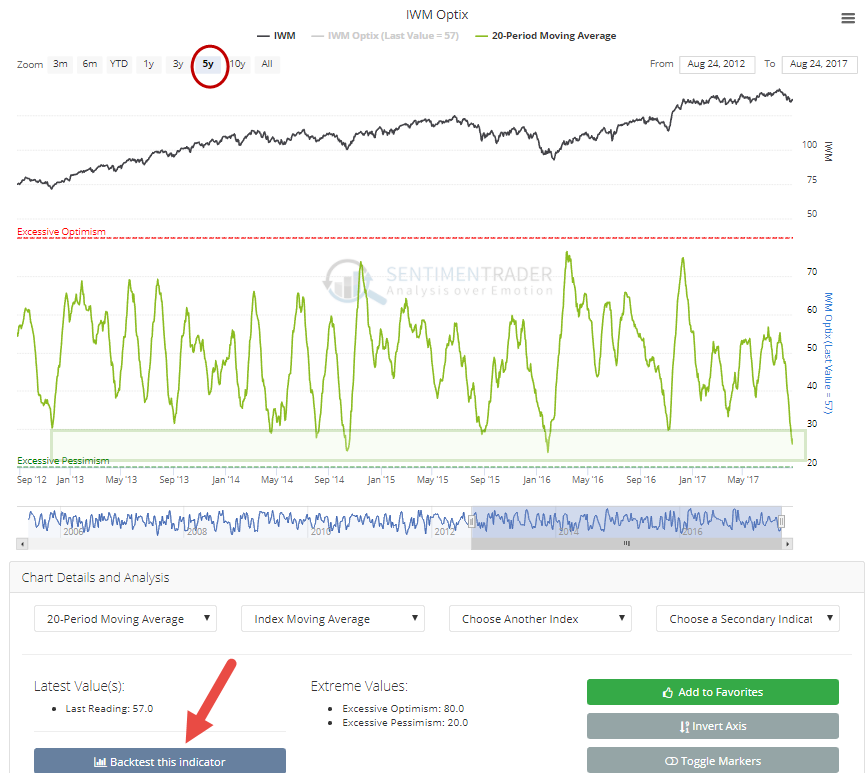
Zoom out on the chart by using the window below the chart, or select 5Y from the boxes to have the chart re-scale and show the past 5 years of history. We can see that the current 20-day average is among the lowest we've seen during that time frame. To see how IWM has performed after similar extremes, click the Backtest This Indicator button.

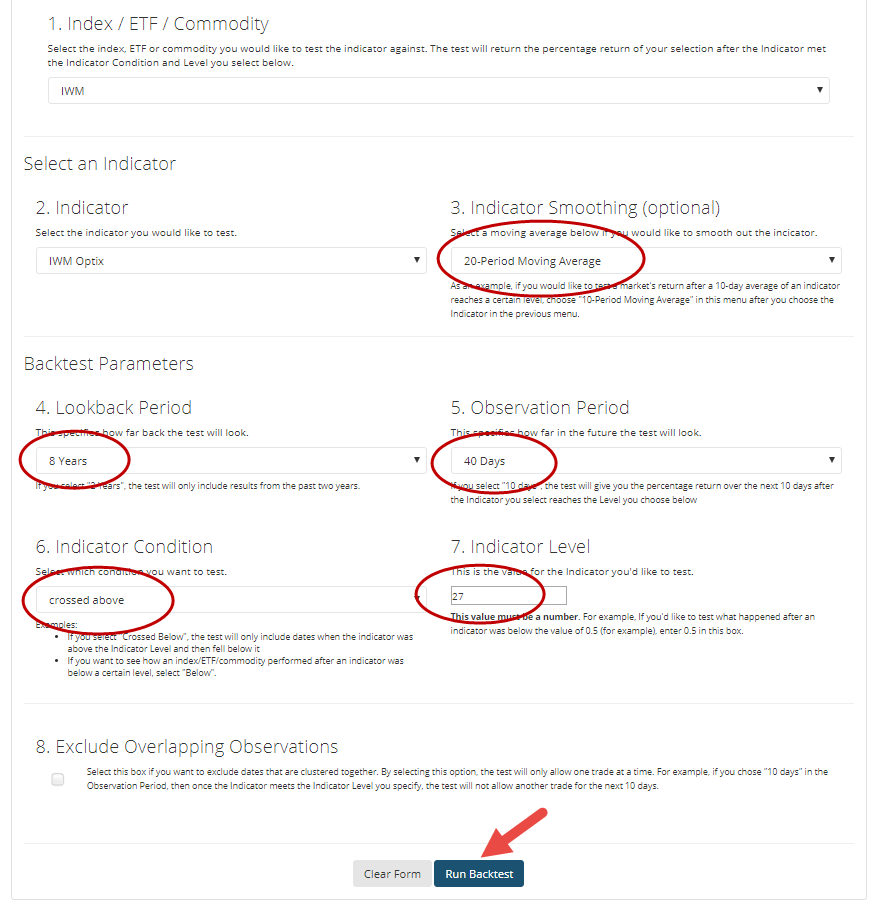
The fund and indicator will already be chosen for you. Then select the 20-period moving average, for the past 8 years (regular subscribers will see history up to the past 5 years, premium tier members can test the whole history), let's look at the next 40 days (not important), and how the market has done after the indicator "crossed above" the level of 27. Then click Run Backtest.

When the results pop up, click the Multi-Timeframe Results tab.

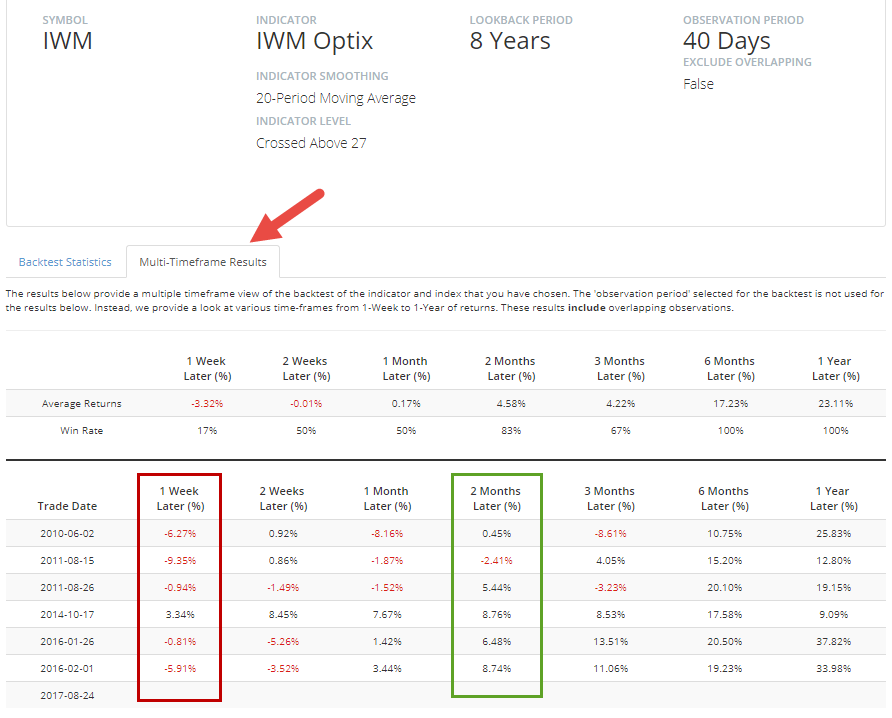
From there, we can see that during this bull market, when IWM has been as hated as it was recently over the past month and sentiment has begun to recover, a week later IWM actually sold off every time but once, and a few of them were stiff. But by two months later, it was higher every time, suggesting that buying into a short-term pullback has been a winning bet after sentiment started to recover from a pessimistic level.

This won't work as well (or at all) during a bear market, but if you go back further you can see how it performed in 2007-2008 as well, to better determine what kind of risk was normal.

DATA &
TECHnologies
IndicatorEdge
‍
BackTestEdge
‍
Other Tools
‍
DataEdge API
RESEARCH
reports
Research Solution
‍
Reports Library
‍
actionable
Strategies
Trading Strategies
‍
Smart Stock Scanner
‍
FREE
RESOUrCES
Simple Backtest
Calculator
Simple Seasonality
Calculator
The Kelly Criterion
Calculator
Sentiment Geo Map
‍
Public Research Reports
‍
Free Webinar
COMPANY
‍
About
‍
Meet our Team
‍
In the News
‍
Testimonials
‍
Client Success Stories
Pricing
Bundle pricing
‍
Announcements
‍
FAQ
© 2024 Sundial Capital Research Inc. All rights reserved.
Setsail Marketing
TermsPrivacyAffiliate Program
Risk Disclosure: Futures and forex trading contains substantial risk and is not for every investor. An investor could potentially lose all or more than the initial investment. Risk capital is money that can be lost without jeopardizing ones’ financial security or life style. Only risk capital should be used for trading and only those with sufficient risk capital should consider trading. Past performance is not necessarily indicative of future results.

Hypothetical Performance Disclosure: Hypothetical performance results have many inherent limitations, some of which are described below. No representation is being made that any account will or is likely to achieve profits or losses similar to those shown; in fact, there are frequently sharp differences between hypothetical performance results and the actual results subsequently achieved by any particular trading program. One of the limitations of hypothetical performance results is that they are generally prepared with the benefit of hindsight. In addition, hypothetical trading does not involve financial risk, and no hypothetical trading record can completely account for the impact of financial risk of actual trading. for example, the ability to withstand losses or to adhere to a particular trading program in spite of trading losses are material points which can also adversely affect actual trading results. There are numerous other factors related to the markets in general or to the implementation of any specific trading program which cannot be fully accounted for in the preparation of hypothetical performance results and all which can adversely affect trading results.

Testimonial Disclosure: Testimonials appearing on this website may not be representative of other clients or customers and is not a guarantee of future performance or success.