
Testing A Wide Disparity Between Smart And Dumb Money

With the volatility in stocks this week, the spread between Smart Money and Dumb Money Confidence rose to 55%, the widest since January 2016.
Our Confidence indices use mostly real-money gauges - there are few opinions involved here. Generally, we want to follow the Smart Money traders when they reach an extreme - we want to bet on a market rally when they are confident of rising prices, and we want to be short (or in cash) when they are expecting a market decline. The higher the confidence number, the more aggressively we should be looking for higher prices.
What is considered "smart" is simply based on an indicator's historical record at extremes. If an indicator is usually showing excessive pessimism near a market peak, and excessive optimism near a market bottom, then that indicator will be included in our Smart Money calculation. And if it consistently shows too much pessimism near a low and too much optimism near a high, it will be considered Dumb Money.
When the Dumb Money is below the Smart Money, then sentiment is negative and stocks are usually struggling. It's best to be defensive at times like this. However, when sentiment becomes too negative, then stocks are often poised to rally over the next 1-3 months.
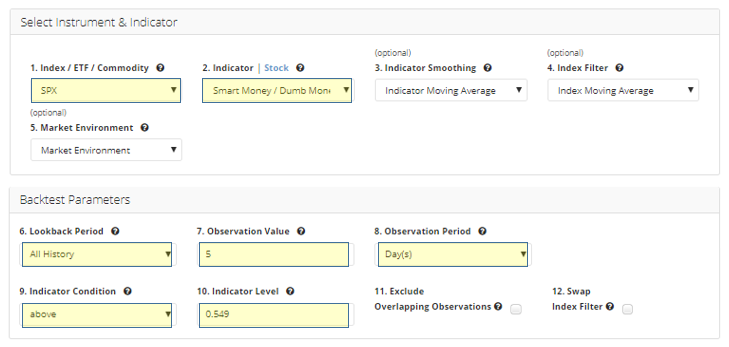
Let’s use the Backtest Engine to look at a few scenarios. First, we’re just going to look the furthest back we can go when the spread was 55% or wider (above 0.549). This is the setup in the Backtest Engine, with yellow highlights where we changed the default setting.
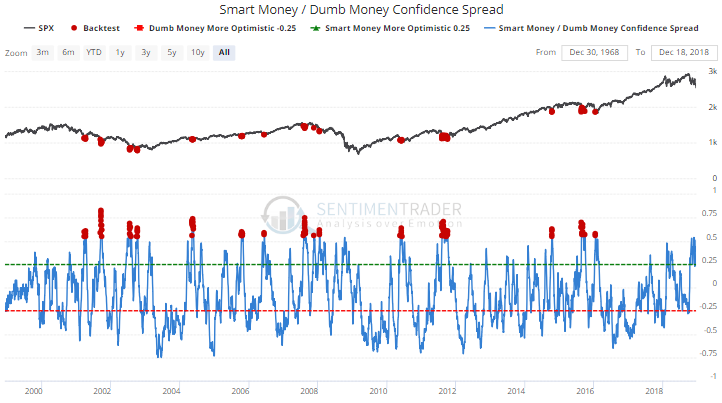
After clicking the Run Backtest button, the chart that pops up looks like this with the signal dates highlighted in red.
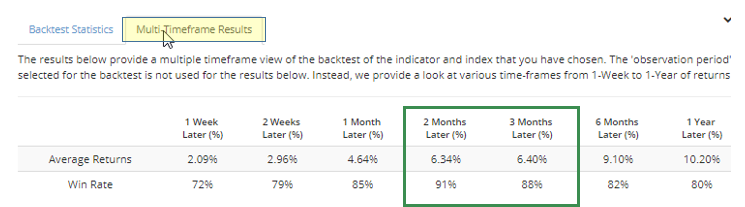
Clicking the tab for Multi-Timeframe Results shows us that the S&P rebounded over the next 2 months 91% of the time and over the next 3 months 88% of the time, with greater than 6% average returns.
That’s great, but of course it’s going to look good in bull markets. If we assume the worst, that we’re now in a bear market environment, then we can see how that changes the results.
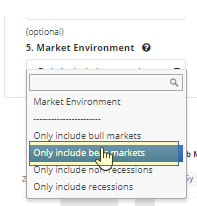
To see what happens then, we can go back up to the Market Environment drop-down box and choose to look only at bear markets. That will put shading on the chart that shows all bear markets during the study period. Click the Run Backtest button again to get the new results.
If we do that and click the Multi-Timeframe Results tab again, we can see that when the spread was 55% or wider only during bear markets, the S&P 500 still rallied over the next three months 96% of the time.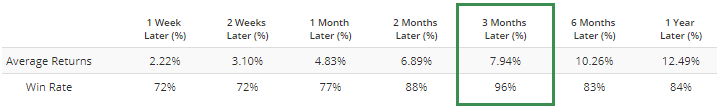
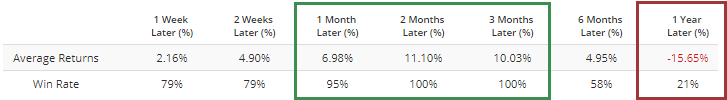
If we go back up and change the “Only include bear markets” to “Only include recessions” and click the Run Backtest button again, then we can see how the market responded to a wide spread in Confidence during recessions.
The next 2-3 months saw a rally after all 19 dates, but the 1-year returns were poor.
If we are more optimistic and assume that we’re still in a bull market and change the Market Environment to “Only include bull markets” then run the backtest again, the S&P’s returns were (of course) quite positive, but skewed more toward the shorter-term.
Overall, no matter the market we’re in, such a wide spread has been a good medium-term sign for stocks. You can also change the Index/ETF/Commodity to see how other indexes or ETFs fared after spreads this wide.