
Technology and Inflation DO NOT Mix

To say that technology has taken the world by storm in the past 25 years would be an understatement - just how it has taken the investment world by storm. To gain an appreciation of exactly how much the impact of technology has accelerated in recent decades, consider the two charts below.
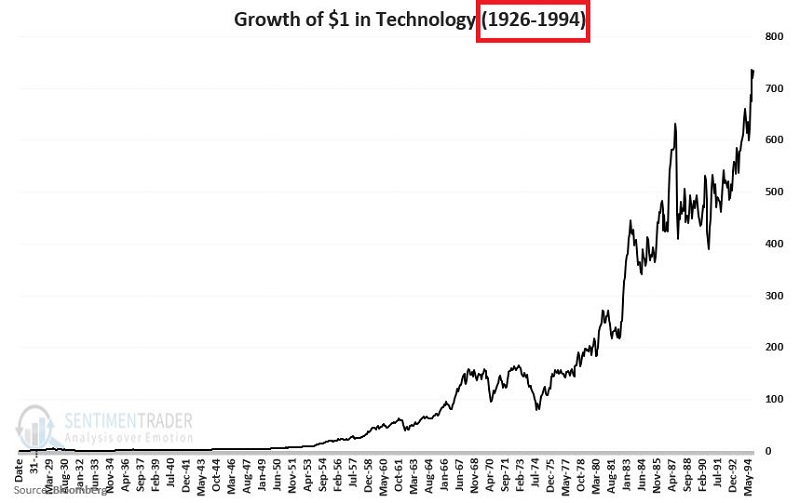
The first chart displays the growth of $1 invested in the S&P 500 Technology Sector from 1926 through 1994.
The next chart extends the chart above into May of 2021.
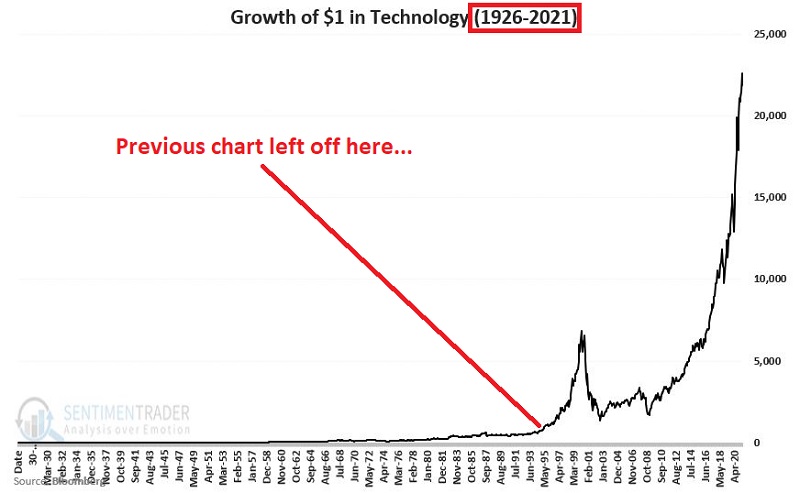
The above sort of speaks for itself. Starting in 1995, the tech sector:
- Exploded higher by over 900% in just over 5 years
- Then lost over -82% in about two and a half years
- Then proceeded to rally over 1,700% in the years since
At this point, it is essentially a given in most people's minds that "Technology is King." And within the realm of investing, a lot of people have come to accept that high valuations for top technology companies are not only "just the way it is" but that these valuations are "justified."
I mean, "what could slow technology stocks down," one might ask.
Well, inflation, for one thing.
WHEN TECHNOLOGY MEETS INFLATION
No one knows for sure what the future holds. However, history has shown that when inflation reaches a certain level, technology stocks have not performed well. Let's take a closer look.
For our warning sign of high inflationary pressure, we will evaluate the latest Producer Price Index reading at the end of each month. The chart below displays the 12-month change for the PPI since 1926, with the +10% line marked in [COLOR].
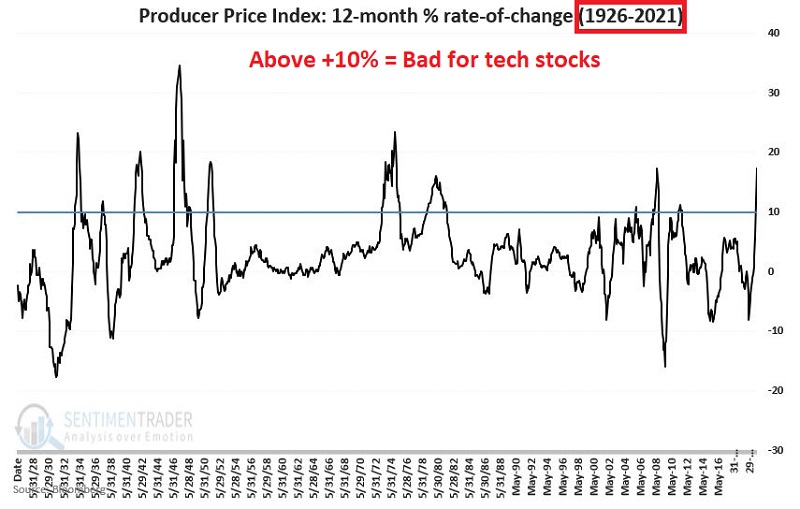
For testing purposes:
- If the 12-month change in the PPI reaches or exceeds +10%, we will consider this "bearish" for technology stocks
- If the 12-month change in the PPI is less than +10% we will consider this "bullish" for technology stocks
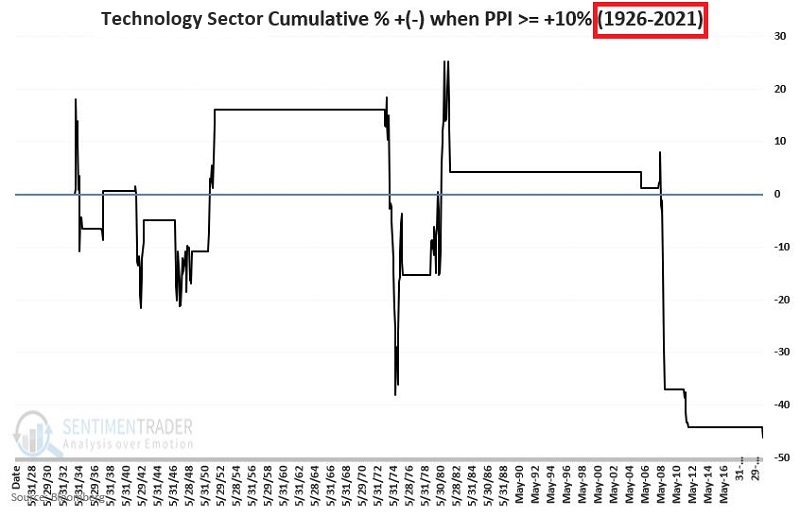
The chart below displays the cumulative % +/- for the same technology sector shown in the charts above ONLY during those months when the previous month ended with the 12-month change in the Producer Price Index at +10% or higher. In all, the S&P 500 Technology sector has lost over 44% while the PPI was over +10%.
The table below displays the technology sector's performance ONLY during those months when the previous month ended with the 12-month change in the Producer Price Index at +10% or higher.
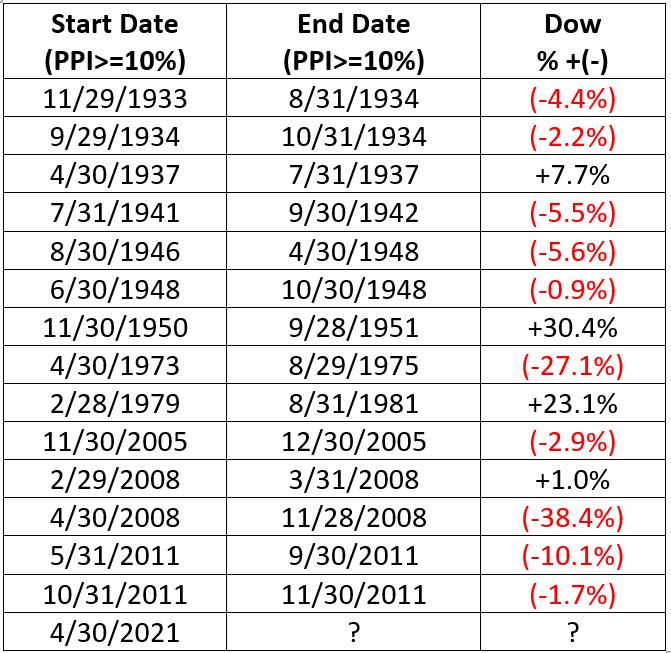
WHERE WE ARE NOW
As we saw in the chart of the 12-month change in the PPI above, our simple indicator is now flashing "bearish" for technology stocks. At the end of April 2021, the PPI 12-month change stood at +12.0%, and at the end of May, it will stand at +17.2% (based on the latest PPI reading).
Does this mean that tech stocks are "doomed" to fall? Not at all. There are obviously many other factors in play that can and will affect the fortunate of the technology sector as a whole. Still, the results above suggest investors pay close attention to their technology stock holdings if the recent uptick in inflation persists.