
Technical warnings on par with prior peaks

Key points:
- Over the past 6 months, there has been a historic cluster of Titanic Syndrome technical warnings
- It highlights an environment where more securities have been falling to 52-week lows than rising to 52-week highs
- The only precedents in 40 years were 1999-00, 2007, and 2015
6 months of warning signs
Near the end of December, there was a surge in buying pressure in many stocks. That led to positive breadth thrusts in the S&P 500 and even among broader securities traded on the NYSE. Markets have not reacted well since, which is a worry.
From a longer-term point of view, there are other concerns. Over the past six months, there have been many days when indexes like the S&P 500 or Nasdaq Composite have reached a 52-week high. However, within mere days, more stocks and other securities were trading at 52-week lows than 52-week highs.
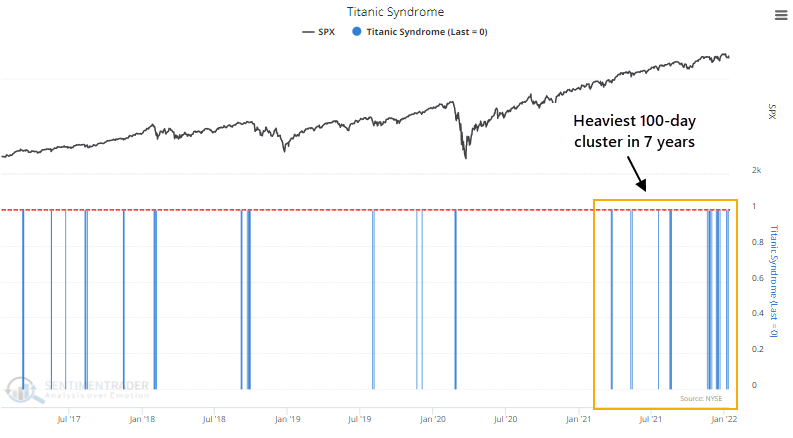
That type of behavior has triggered a cluster of Titanic Syndrome warnings for securities on the NYSE. Since November, there has been a rash of them, with isolated signals dating to last spring.
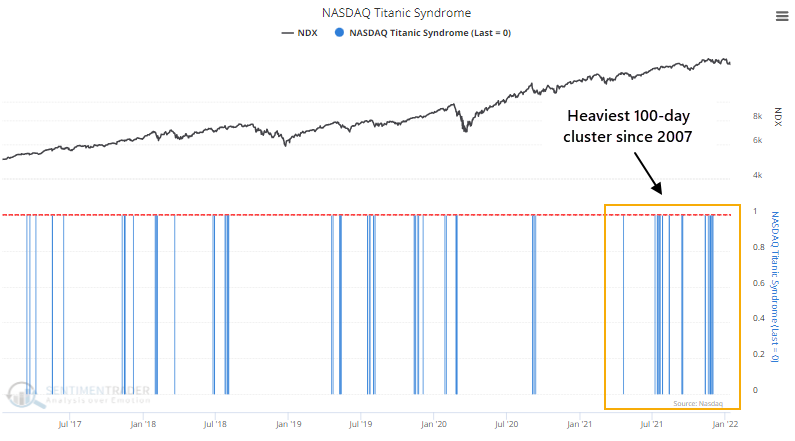
Those haven't just been firing on the NYSE. While fewer lately, there have also been a bunch of signals among securities traded on the Nasdaq.
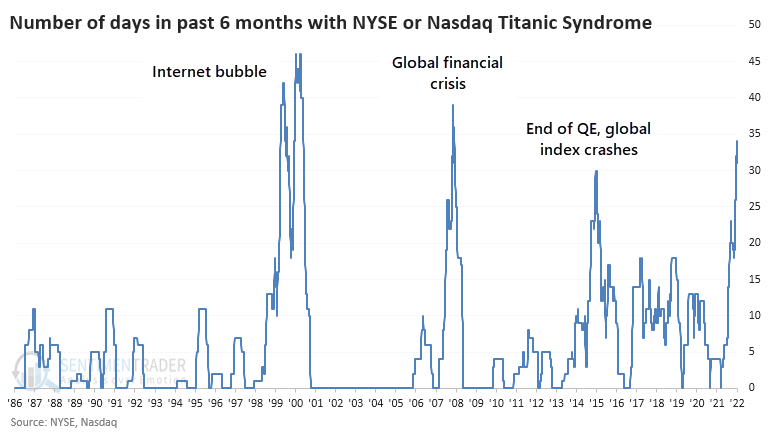
When we combine the signals on both exchanges and tally them up over the past 6 months, there have been 34 signals. In other words, nearly 30% of all days since July have seen a Titanic Syndrome warning on either the NYSE or Nasdaq exchanges. This is the 3rd-highest reading in almost 40 years, next to 1999-2000 and 2007. Early 2015 is the only other environment that comes close.
Peaks in warnings have preceded weak returns
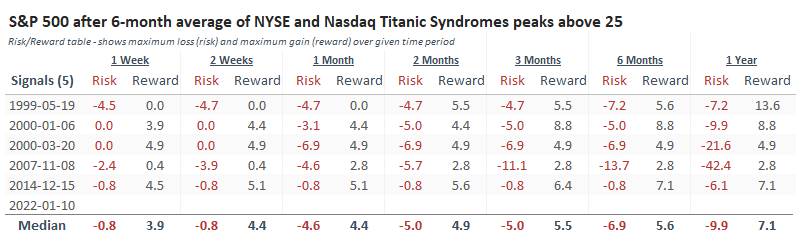
The 6-month rolling sum has just started to curl down, suggesting it may have peaked. After other peaks, the S&P 500 showed minimal upside.
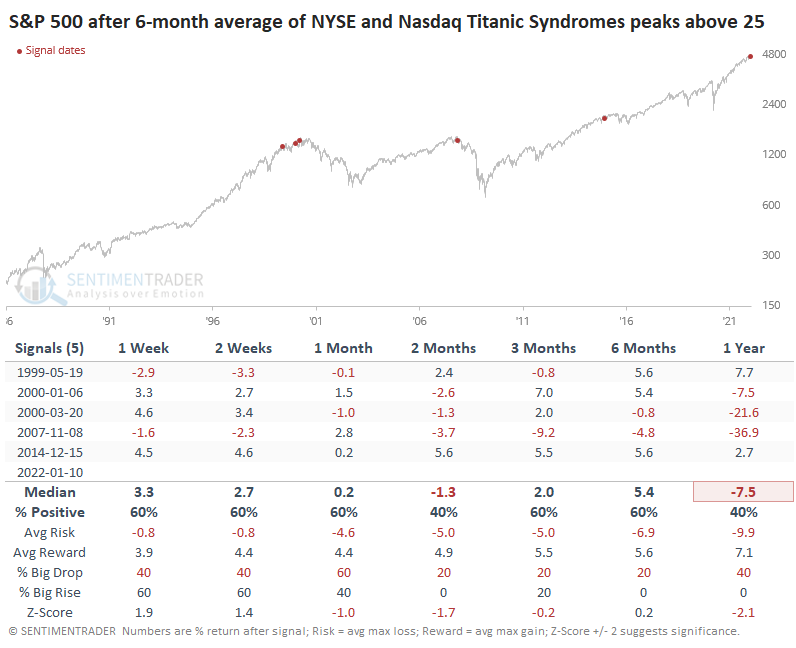
We can see that more clearly in the Risk/Reward Table, which shows choppy conditions, at best, for the most benchmarked index in the world. Not one of the signals showed more than a 10% gain at any point within the next six months. Granted, the sample size is tiny.
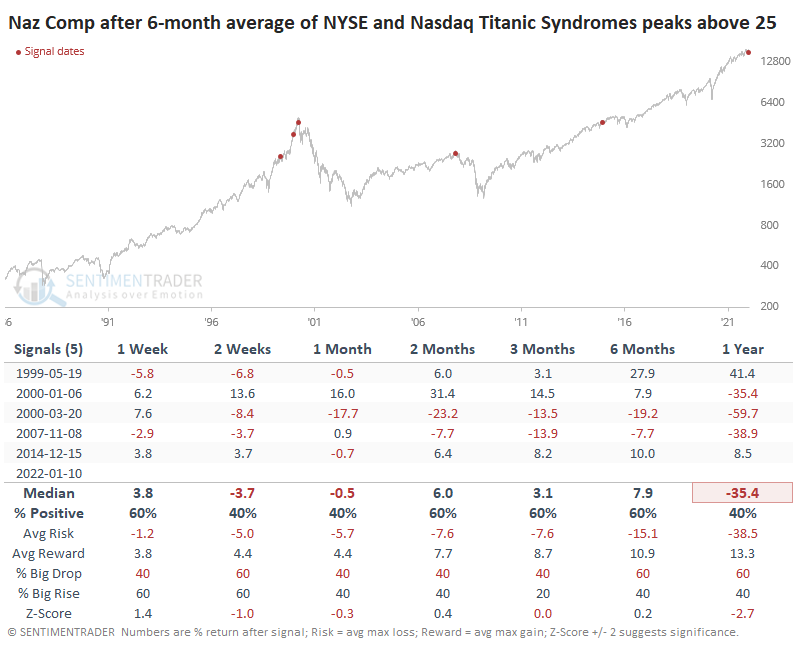
After the same signals, returns in the Nasdaq Composite weren't exactly inspiring, either. While it managed some double-digit gains, its returns were highly volatile.
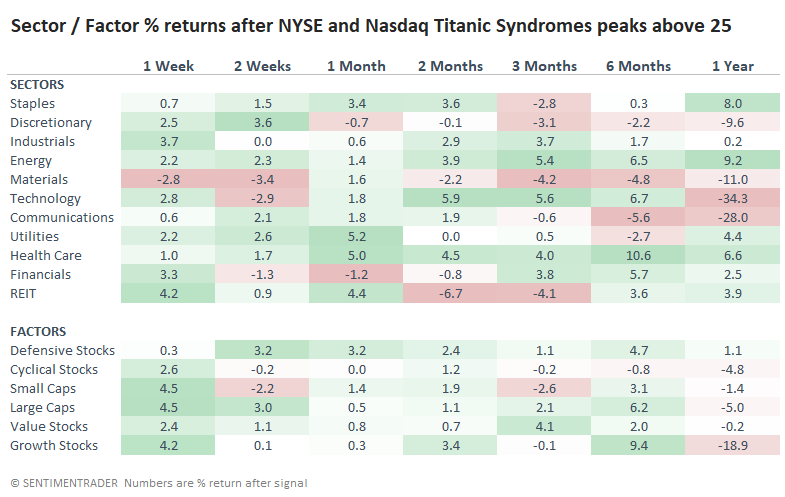
Some of the highest-beta sectors and factors fared the worst returns. Technology, Discretionary, and Growth stocks showed abysmal long-term returns. Staples, Energy, and Health Care showed among the best.
What the research tells us...
The tendency to see more securities falling to 52-week lows than rising to 52-week highs soon after major indexes themselves closed at new highs is disturbing. This kind of behavior has been going on for 6 months or more and is among the most egregious in 40 years. Other warnings of split market environments, like the Hindenburg Omens on the NYSE and Nasdaq, haven't triggered nearly as many times, so that's perhaps some small solace.