Data &
Technology
Research
Reports
Report Solutions
Reports Library
Actionable
Strategies
Free
Resources
Simple Backtest Calculator
Simple Seasonality Calculator
The Kelly Criterion Calculator
Sentiment Geo Map
Public Research Reports
Free Webinar
Pricing
Company
About
Meet Our Team
In the News
Testimonials
Client Success Stories
Contact
Log inLoginSign up
< BACK TO ALL REPORTS

Tech stocks show returning internal momentum

Jason Goepfert
2020-11-04
The McClellan Oscillators for the Nasdaq 100 and wider technology sector have turned positive after a couple of weeks being negative, and deeply so. This typically results in more medium-term strength, especially for the broader market.

Thanks to at least a temporary pre- and post-election sigh of relief among technology investors, underlying momentum in many of those names has turned positive.

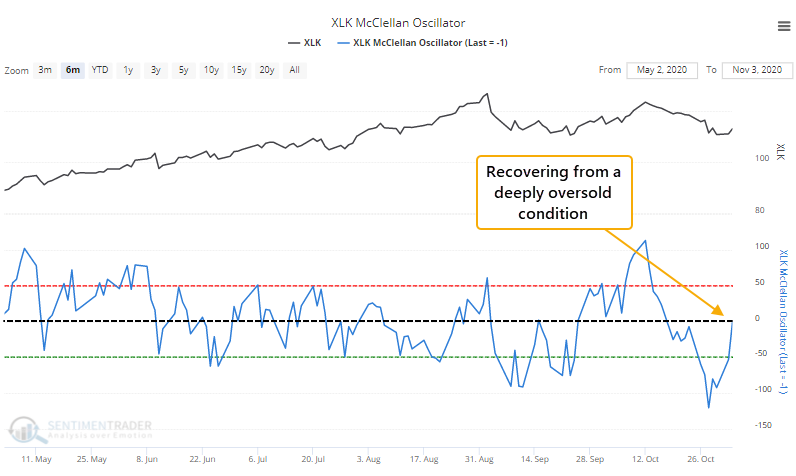
The McClellan Oscillator for the broader tech sector will move into positive territory on Wednesday after a couple of weeks below zero (barring a historic intraday reversal after this is published), and with a severely oversold reading during that span.

The Oscillator is telling us that the average stock in that sector is not only rising, but doing so at an increasing pace. And that's within the context of the S&P 500 Information Technology sector still being more than 5% above its 200-day moving average. It's showing recovering momentum during an already-momentum-driven market.

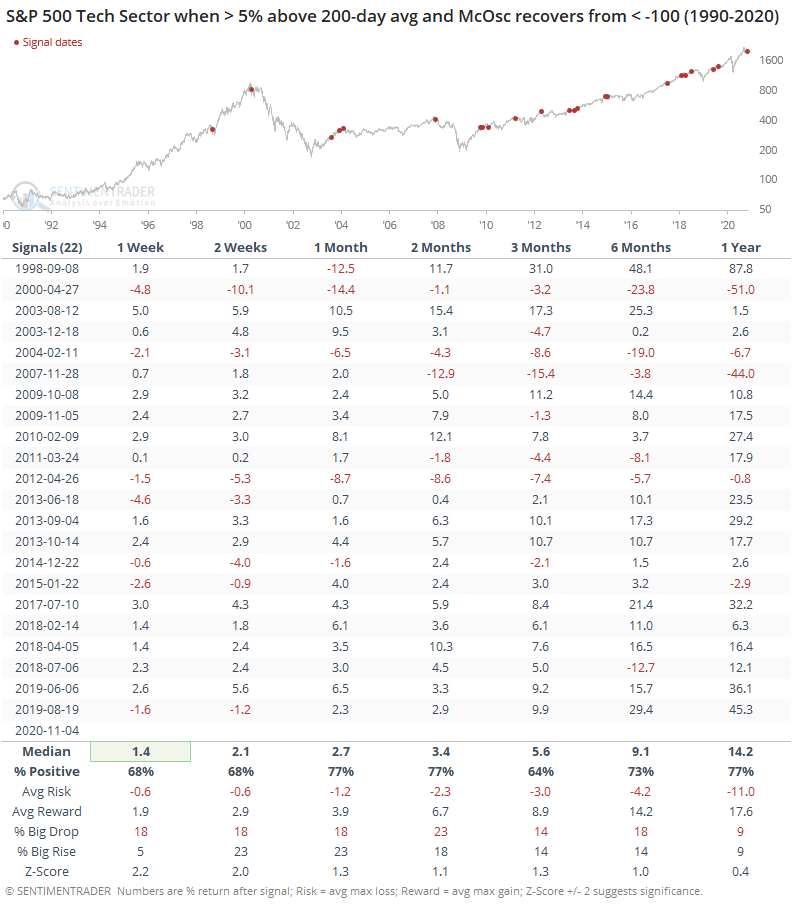
This was a mostly good sign for the sector, especially over the next 1-2 months, which had the best combination of average returns, percentage of time positive, and risk/reward ratio, especially in recent years. The probability of a big rise was about equal to that of a big drop, but both were small.

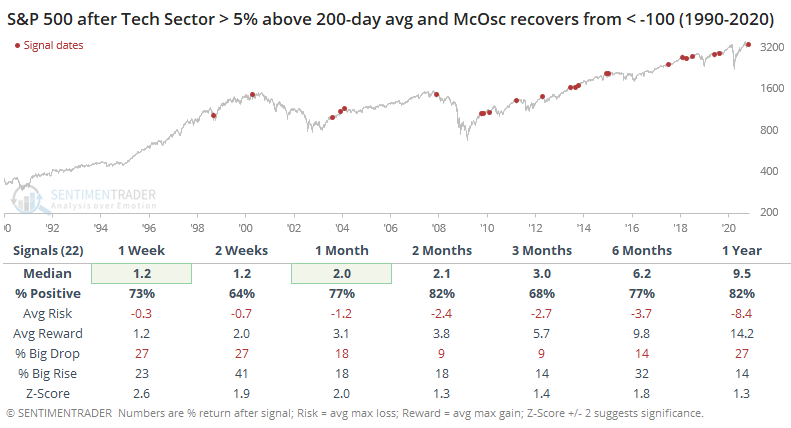
For the broader S&P, it was an even better sign, with only 4 losses out of 22 signals after 2 months.

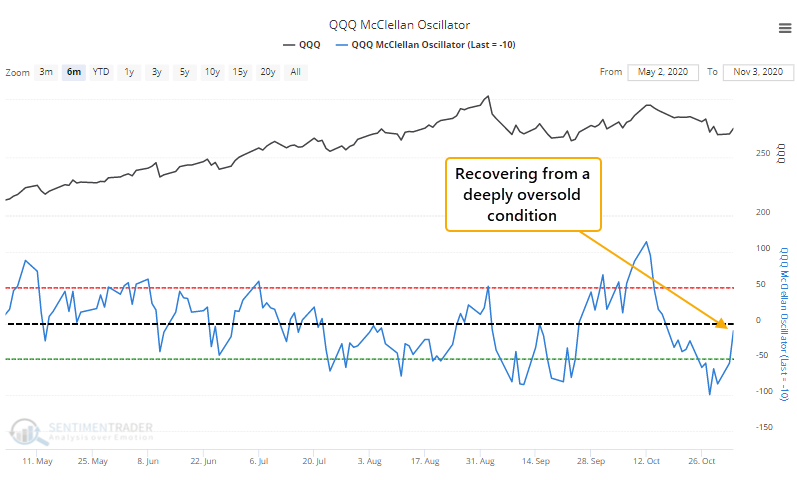
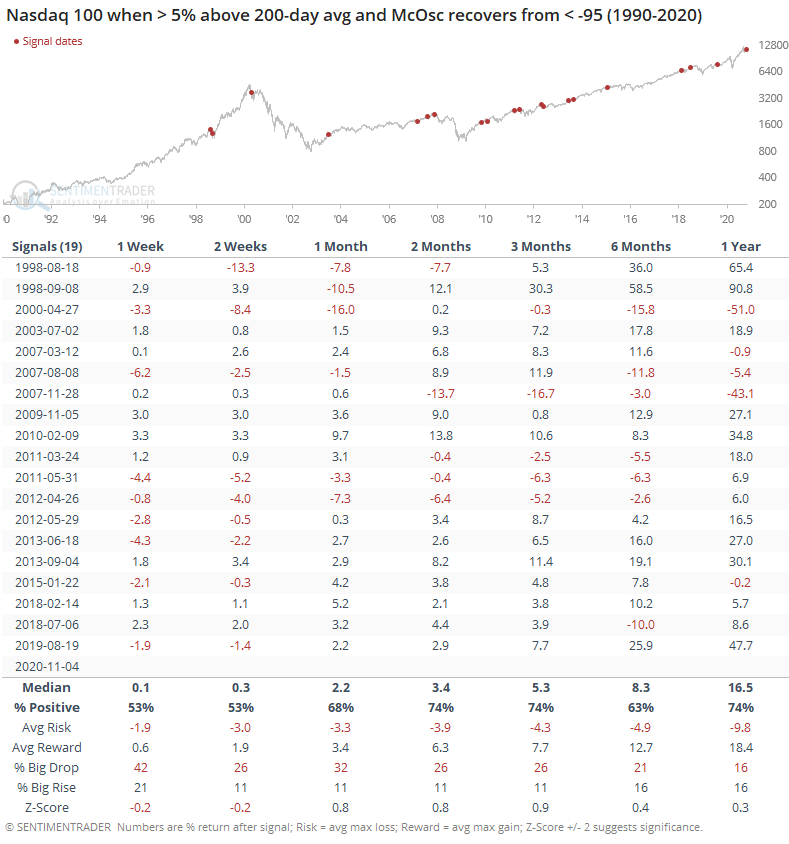
We're seeing the same thing happening among the biggest tech stocks, as the McClellan Oscillator for the Nasdaq 100 is also recovering from a deeply oversold condition.

This was less of a positive for the biggest stocks, especially shorter-term. Still, over the next 2-3 months, they typically rose. It wasn't a very strong signal, mostly due to some losses from 2008 - 2012.

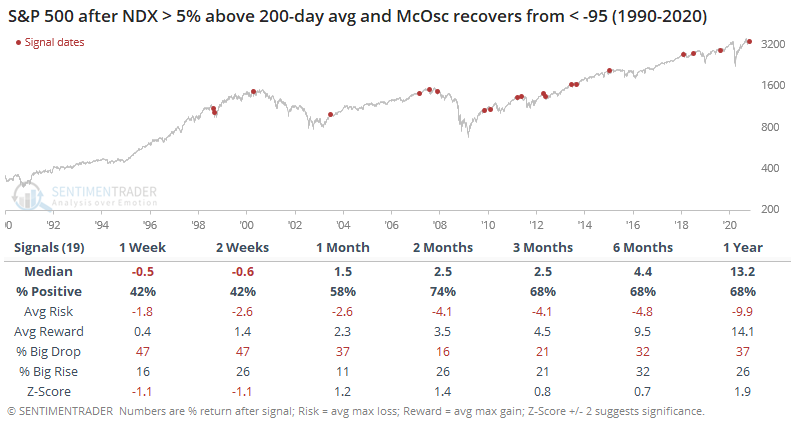
It was less of a positive for the S&P 500 in the short-term.

Markets have a nasty habit of showing a fake-out first move following major and widely anticipated events. That makes it hard to trust the knee-jerk reaction to Tuesday's elections. While momentum in many tech stocks has turned positive, it hasn't been a very reliable signal in the shorter-term, and the fact that it's triggering around a major news event probably makes it even less so. It should still be at least a minor medium-term positive.

Sorry, you don't have access to this report

Upgrade your subscription plan to get access
Go to Dasboard
DATA &
TECHnologies
IndicatorEdge
‍
BackTestEdge
‍
Other Tools
‍
DataEdge API
RESEARCH
reports
Research Solution
‍
Reports Library
‍
actionable
Strategies
Trading Strategies
‍
Smart Stock Scanner
‍
FREE
RESOUrCES
Simple Backtest
Calculator
Simple Seasonality
Calculator
The Kelly Criterion
Calculator
Sentiment Geo Map
‍
Public Research Reports
‍
Free Webinar
COMPANY
‍
About
‍
Meet our Team
‍
In the News
‍
Testimonials
‍
Client Success Stories
Pricing
Bundle pricing
‍
Announcements
‍
FAQ
© 2024 Sundial Capital Research Inc. All rights reserved.
Setsail Marketing
TermsPrivacyAffiliate Program
Risk Disclosure: Futures and forex trading contains substantial risk and is not for every investor. An investor could potentially lose all or more than the initial investment. Risk capital is money that can be lost without jeopardizing ones’ financial security or life style. Only risk capital should be used for trading and only those with sufficient risk capital should consider trading. Past performance is not necessarily indicative of future results.

Hypothetical Performance Disclosure: Hypothetical performance results have many inherent limitations, some of which are described below. No representation is being made that any account will or is likely to achieve profits or losses similar to those shown; in fact, there are frequently sharp differences between hypothetical performance results and the actual results subsequently achieved by any particular trading program. One of the limitations of hypothetical performance results is that they are generally prepared with the benefit of hindsight. In addition, hypothetical trading does not involve financial risk, and no hypothetical trading record can completely account for the impact of financial risk of actual trading. for example, the ability to withstand losses or to adhere to a particular trading program in spite of trading losses are material points which can also adversely affect actual trading results. There are numerous other factors related to the markets in general or to the implementation of any specific trading program which cannot be fully accounted for in the preparation of hypothetical performance results and all which can adversely affect trading results.

Testimonial Disclosure: Testimonials appearing on this website may not be representative of other clients or customers and is not a guarantee of future performance or success.