
TCTM - Composite Confirmation Model Component Signal

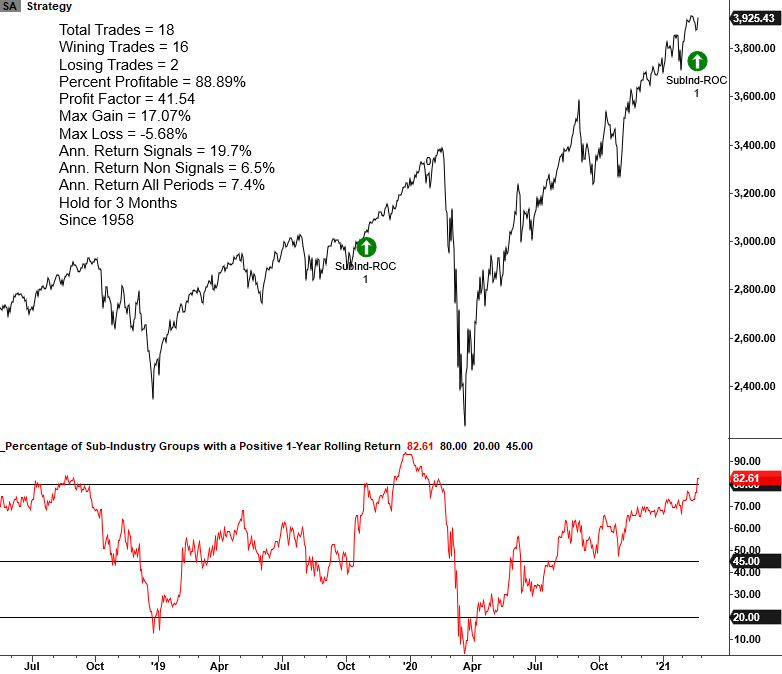
In my Tactical Composite Trend Model (TCTM) update last week, I mentioned that one of the ten components in the Composite Confirmation Model (CCM) had failed to register a buy signal post the pandemic low. The indicator measures the percentage of sub-industry groups with a positive 1-year rolling return. As prices started to roll down from the February 2020 peak this week, the 252-day rate of change calculation ticked up for more groups, and the indicator increased above the threshold level (80%) for a signal on 2/23/21. I designed the CCM to identify the difference between a bear market rally and the start of a new cyclical uptrend. Because the individual indicators within the model utilize big picture concepts, the signals are not as timely as other TCTM components.
EDIT: This was updated after publication to change the signal date from 3/23 to 2/23/21
Let's take a look at a few historical chart examples and the signal performance.
Please note, signal resets occur on a cross below 45%.
CCM - Sub-Industry Group Momentum Chart
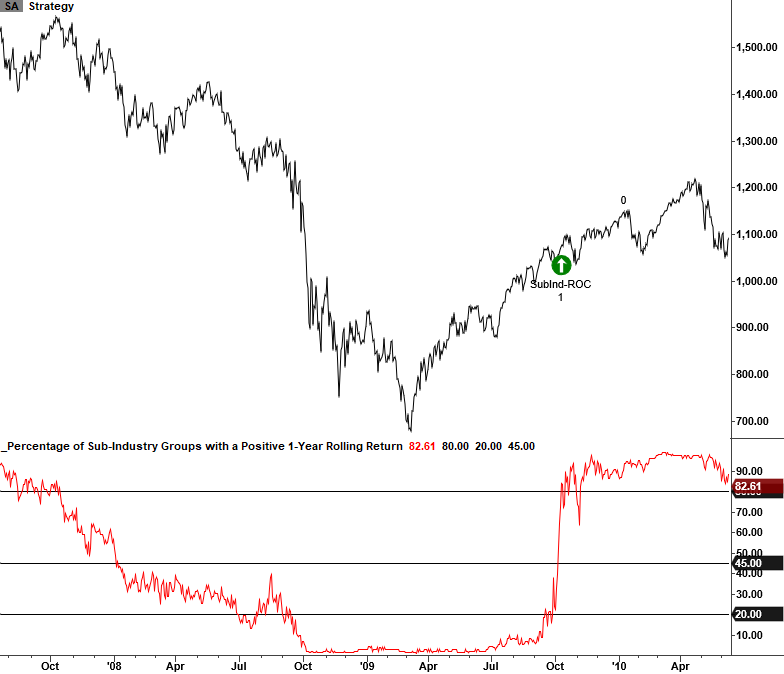
CCM - Sub-Industry Group Momentum Chart
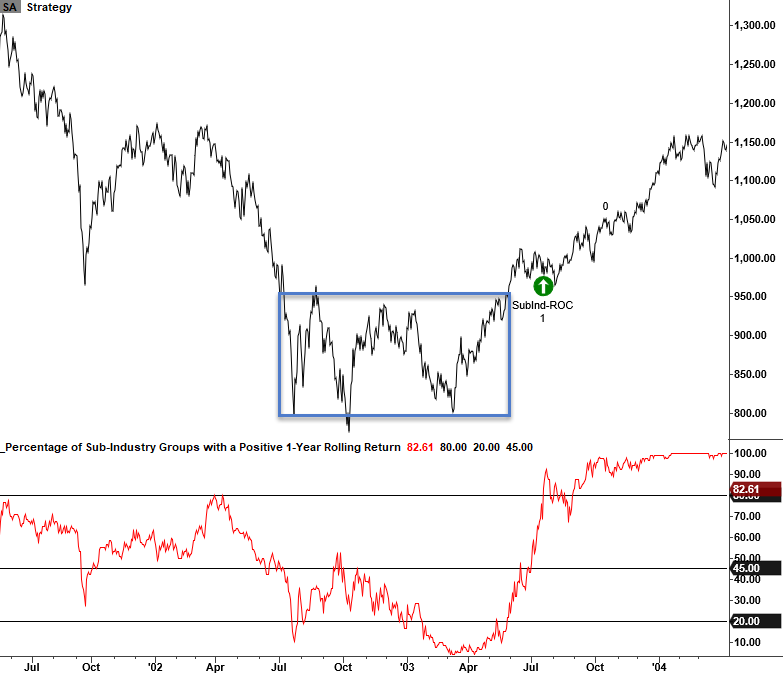
CCM - Sub-Industry Group Momentum Chart
I included a chart of the 2002-03 bottom so one can see how a normal bottoming process sets up a better risk/reward profile as prices consolidate in a sideways pattern before breaking out.
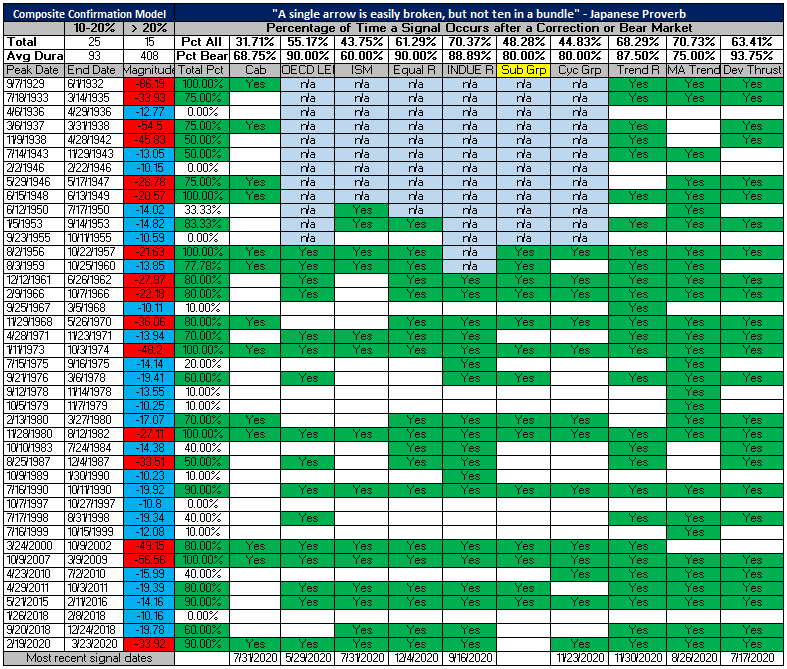
CCM Component Historical Signal Table
The table below shows CCM signals started to trigger at the end of May 2020 and continued to register over the next six months.
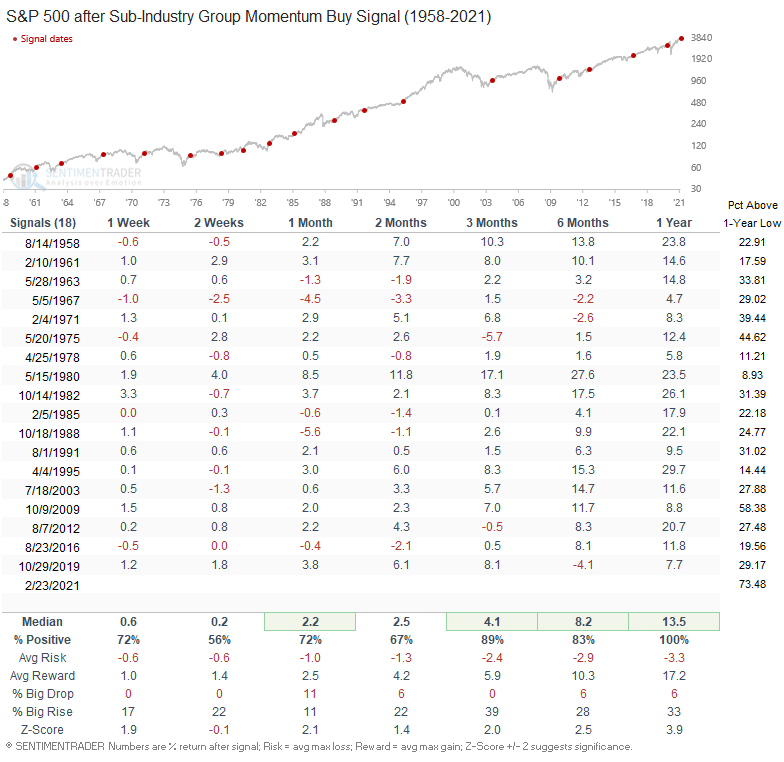
CCM - Sub-Industry Group Momentum Performance
As the table below shows, the long-term results for the indicator are excellent. However, the signal occurred after a 73.48% gain from the low.
On average, previous signals occurred after a 27% gain from the bear market or correction low. The pandemic crash and v-shaped bottom wreaked havoc on long-duration indicators like this one from a timing perspective.
Conclusion: As we've seen from several other long-duration momentum indicators, the backdrop for the market remains constructive.