
Taking the LEAP

In the world of options trading the term LEAP stands for "Long-term Equity Anticipation Securities" (those marketing folks stay up late, don't they? Of course, for a lot of investors, they sometimes stand more for "Long-term Equity Anxiety Securities". I guess that's why they let the marketing folks come up with the names).
LEAPS are simply call or put options that have more than 1 year left until expiration at the time they start trading.
For our example, we will focus on buying a LEAP call option in anticipation of a rise in the price of the underlying stock.
The Good News
- Buying a LEAP can give an investor 1 to 3 years for the underlying stock to make a move
- LEAPS typically allow an investor to take a position at a fraction of the cost of buying the underlying stock shares
- Once the stock reaches the breakeven price for the option trade (strike price + price paid for a call option), the LEAP enjoys dollar-for-dollar gain with the stock itself - despite costing much less
The Bad News
- You pay a premium to buy a LEAP so the stock must move a certain distance beyond its price at the time you entered in order for the LEAP to generate a profit
- Despite the reduced cost of entry it is still possible to lose more money by holding a LEAP than by holding the stock (due to time decay if the stock remains relatively unchanged)
- You do not collect any dividends while holding a LEAP
Example Trade using Ticker VZ
For illustrative purposes, we will look at a trade using a LEAP on ticker VZ (Verizon). Please note that I AM fully agnostic on the future direction of VZ stock and AM NOT making any recommendations. We are simply using this stock as an example.
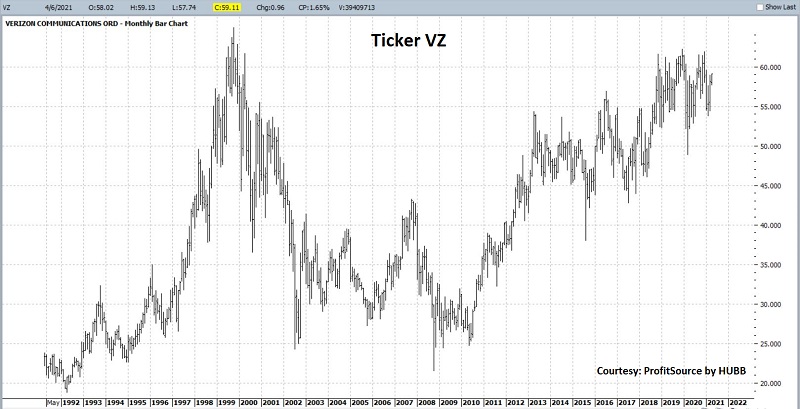
A monthly bar chart for VZ appears below (chart is courtesy of ProfitSource by HUBB).
When to Buy a LEAP Call Option
In the broadest stroke possible, there are two things you should look for when considering buying a LEAP call:
- A reason to believe that the underlying stock is going to rise in the year (or more) ahead
- And ideally, lower than average implied volatility
Let's address the second point first. The price of a call option can include "intrinsic" and "extrinsic" value.
Intrinsic value is simply what the option would be worth if it expired today. If you buy a call option with a strike price of $45 and the stock is presently trading at $50 a share then the call has $5 of intrinsic value.
Anything beyond that - and the entire price for an out-of-the-money call option - is comprised solely of extrinsic value or time premium. One of the biggest determinants of the amount of time premium in the price of an option is implied volatility (IV). High implied volatility equates to a lot of time premium built into the price of an option; low implied volatility equates to a smaller amount of time premium.
This can be critically important when trading LEAPS for the following reason:
The more time left until option expiration the more time premium fluctuates based on changes in implied volatility.
If you buy a LEAP when IV is extremely high, a sharp decline in IV can cause the price of your call option to collapse, even without a significant decline in the price of the stock shares. Conversely, if you buy a LEAP when IV is low, a sharp increase in IV during the life of the trade can serve to inflate the value of your call option - even without a large movement in the price of the stock shares.
Using IV on VZ
The chart below displays 4-years of VZ price action along with the fluctuations in IV (the dark black line). For most of the time average IV was in the 10% to 25% range, with occasional spikes above 30% - during the covid selloff IV soared as high as 70%).
All screenshots below are courtesy of www.OptionsAnalysis.com.
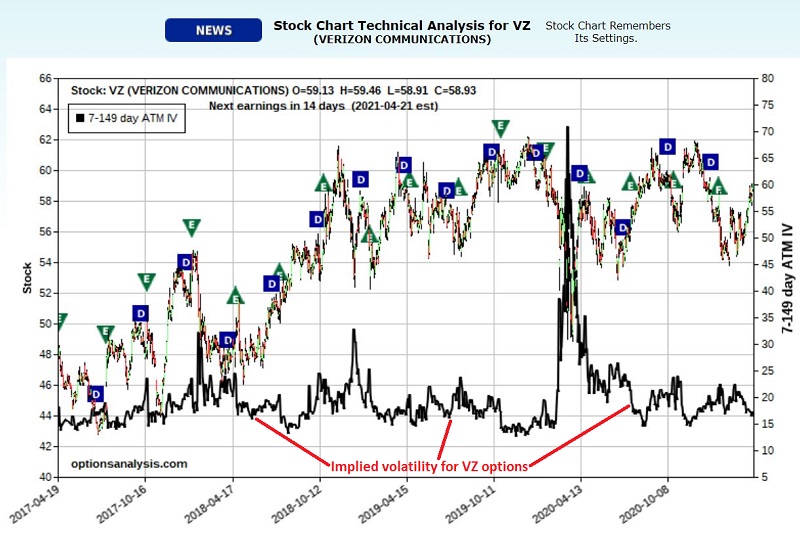
As you can see, IV is presently near the low end of the historical range. This tells us that options are relatively cheap, i.e., that there is a low amount of time premium built into the option price.
Example Trade
One choice would be simply to buy 100 shares of VZ stock at $58.93 a share, at a cost of $5,893. A position of 100 shares of stock is considered to be a position of 100 deltas.
Our example LEAP trade involves buying 2 Jan2023 35 strike price calls @ $6.00. The particulars appear in the screenshot below.
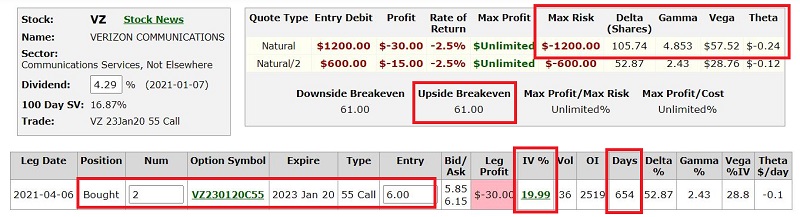
A few key things to note about this trade:
- Cost to enter is $1,200 versus $5,893 to buy 100 shares of stock
- It has a Delta of 105.74 - this tells us that the value of this position will rise or fall roughly equivalent to a position holding 106 shares of VZ
- Vega is positive - this tells us that if implied volatility rises the value of this positive will grow (and vice versa)
- Theta is negative - this tells us that this position will lose a little bit of time value each day due solely to time decay
- The breakeven price vis a vis VZ stock is $61 a share ($55 strike price + $6.00 paid for the option)
- The implied volatility for this call is 19.99%. As we saw in the chart above this is about average. It could decline which would cause time premium to decline and reduce the value of the option. However, if there is another volatility spike between now and January 2023, the value of this option could spike also, possibly creating an opportunity to take an early profit or to adjust the position and lock in a profit.
- There are 654 days, or roughly 21 months, for VZ to make a move to higher ground
The expected dollar profit or loss for this position as of option expiration in Jan 2023 based on the price of VZ stock at that time appears in the chart below.
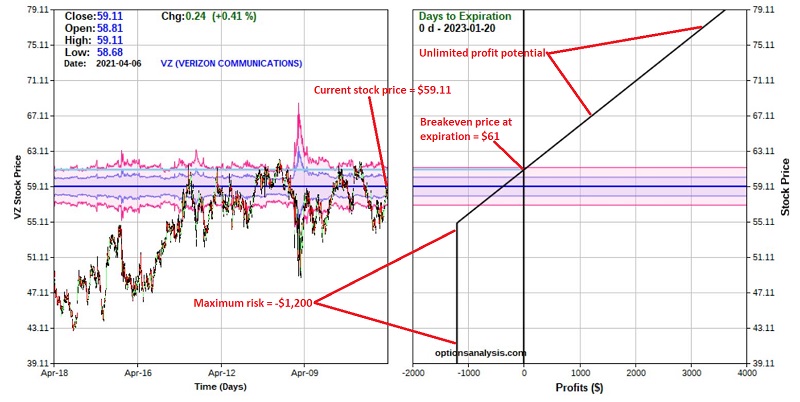
The expectations are pretty straight forward:
- If VZ rises above the breakeven price of $61 a share (which is less than $2 from its current price) then the option will gain dollar-for-dollar with the stock price
- If VZ fails to rally over the next 21 months the worst case is a loss of -$1200, which would occur if we held the option expiration AND VZ was at or below $55 a share at the time
Comparing LEAP to Stock
The chart below compares the risk curves for the LEAP position versus holding 100 shares of VZ stock. The black line equals the expected return for 2 Jan2023 55 LEAPs. The gray line represents the expected return for 100 stock shares.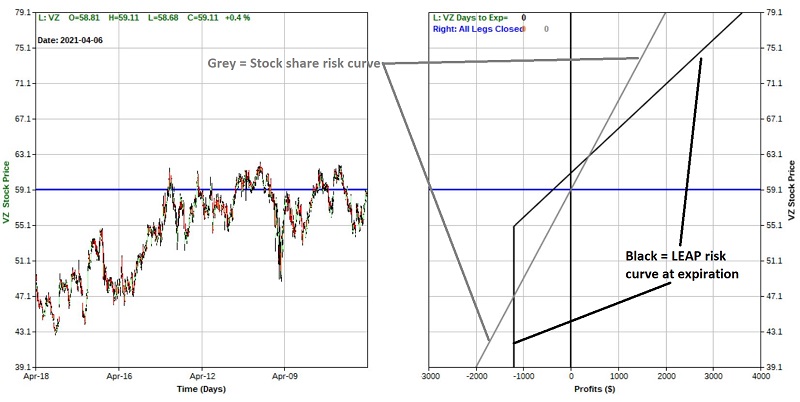
Things to note:
- If VZ does in fact break out to new highs and runs higher the option position stands to generate a much higher dollar profit even though it cost only 20% as much to enter as the stock position
- If VZ is between roughly $47.50 and $63 a share at expiration, the option position can actually lose more money or generate less profit than the 100-share stock position
- If VZ drops below roughly $47.50 a share, the stock will continue to lose $100 for each point of price decline; the worst-case loss for the LEAP option position is -$1,200
- It should be noted that VZ stock presently pays a dividend in excess of 4%; the holder of a LEAP does NOT collect any dividends!