
T-Bonds February Split Personality

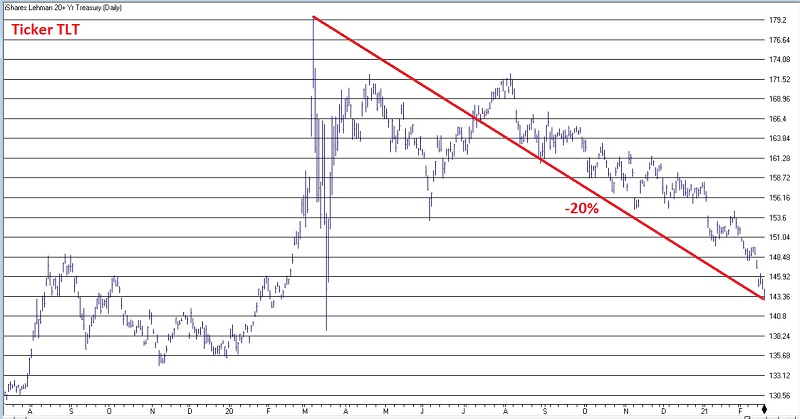
30-year treasury bonds topped out in early March 2020, then went sideways for the better part of six months. Since the peak ticker TLT has lost -20% and a lot of investors are beginning to become alarmed. And not without good reason (rising yields, massive money printing, fears of inflation, etc.).
Still, as it turns out perhaps people should not have been so surprised that t-bonds sold off in February. And maybe - just maybe - they are becoming alarmed at an inopportune moment, at least on a very short-term basis.
Few traders are fully aware of t-bonds "split personality" in the month of February. So, let's spell it out as succinctly as possible:
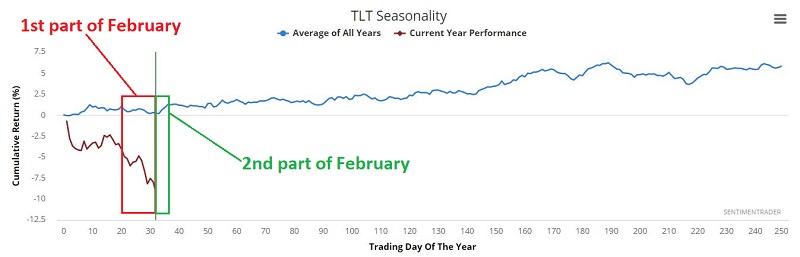
- February trading days 1 through 14 = Bad
- February trading days 15+ = Good
You can get the gist of this seasonal tendency in the TLT seasonality chart below.
Can it really be that simple? I'll show you the numbers and you decide for yourself (this is sort of a throwback to the era of "We report, you decide" as opposed to most media today who's mantra seems to be "We decide, then we report". But I digress.)
Data Note: The following results are calculated by using the daily dollar value change for the front 30-year treasury bond month. Each point for the price of a t-bond futures contract is worth $1,000, so if the contract price rises from $159 to $160 then the value of the contract increases from $159,000 to $160,000 and the daily dollar value change for that day is +$1,000. The results below are completely hypothetical and include no deductions for slippage and commission. The purpose is strictly to highlight t-bond future performance during certain periods of time.
First, let's look at how t-bonds perform during February trading days #1 through 14.
- The chart below displays the cumulative hypothetical result achieved by holding long a 1-lot position in t-bond futures ONLY during the 1st 14 trading days of every February starting in 1978
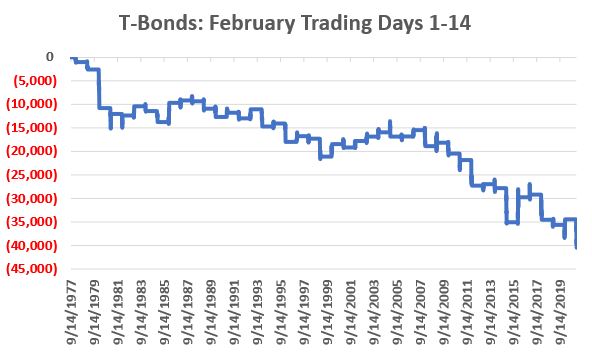
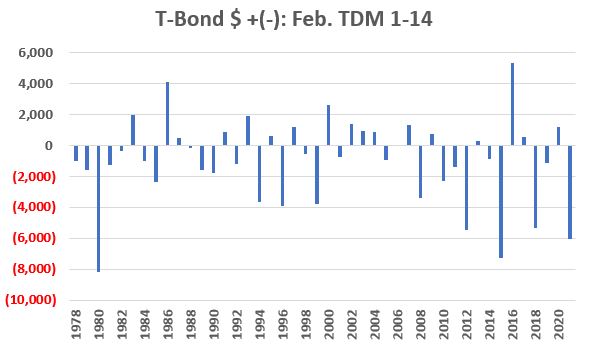
Not a pretty picture. The chart below displays results on a year-by-year basis
Now let's look at the rest of the month.
- The chart below displays the cumulative hypothetical result achieved by holding long a 1-lot position in t-bond futures ONLY during trading day #15 through the end of the month of February starting in 1978
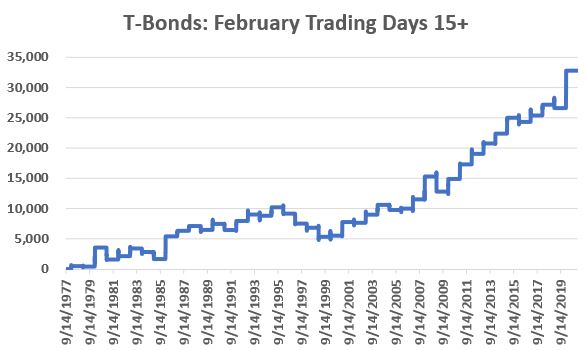
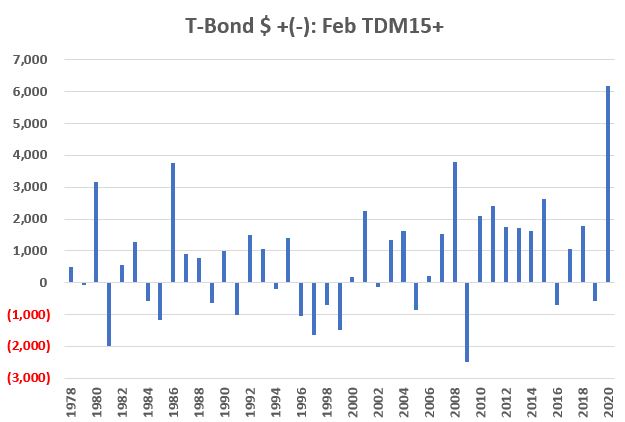
A much prettier picture. The chart below displays results on a year-by-year basis
Just to make things more interesting, consider the following "strategy" (such as it is):
- February Trading Days #1 through 14 = Short 1-lot of t-bond futures
- February Trading Days #15+ = Long 1-lot of t-bond futures
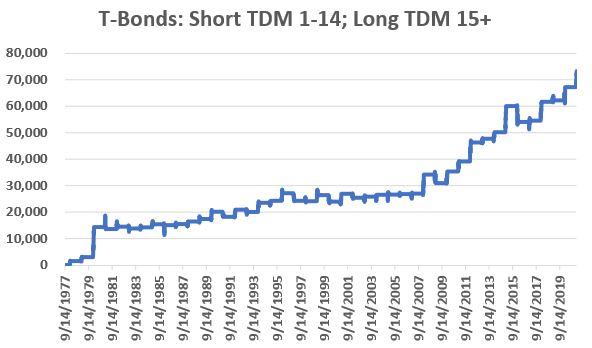
The chart below displays results of this "short then long" approach on a year-by-year basis.

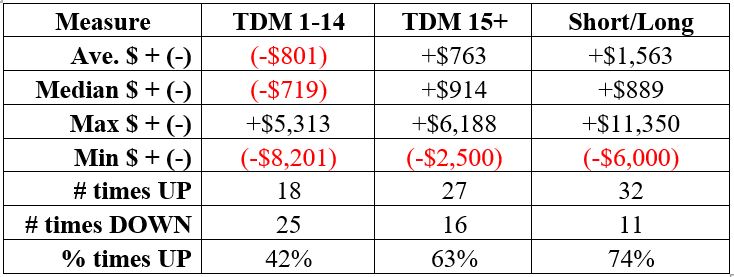
The table below summarizes the results.
Current Status
The 14th trading day of February ended at the close on 2/19 with t-bond futures down roughly -$6,000 so far for the month. So now that the "unfavorable" period is out of the way is it "smooth sailing" for t-bonds? Can we expect t-bonds to bounce higher in the remaining 5 trading days of February?
To answer that question, I will default to the default - "We report, you decide." On one hand, fewer things in trading entail more potential peril than buying into a market in the midst of an accelerating decline. So traders not comfortable with counter-trend trading might do best to simply steer clear. On the other hand, if t-bonds do find a bottom soon and reverse, the bounce could be swift and substantial. For traders wishing to consider things more closely, alternatives to t-bond futures include the ETFs ticker TLT (iShares 20+ Year Treasury Bond) and ticker TMF (Direxion Daily 20+ Year Treasury Bull 3X Shares). There are also options traded on both of those tickers.