
T-bonds and the election cycle

Key points
- Many investors are familiar with the impact of the election cycle on stocks
- Far fewer are familiar with the impact of the election cycle on T-bonds
- Particular months within the four-year election cycle have seen some surprisingly consistent results for long-term treasuries
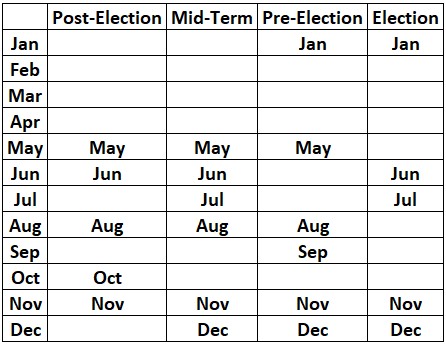
The t-bond election cycle calendar
The t-bond election cycle calendar is not intended to be used as an automated trading system. It is best used as a "weight of the evidence" indicator to offer clues regarding the potential performance of long-term treasury bonds.
The table below displays the four years of the election cycle and the months of each year. The "favorable" months for treasuries for each list the month name in the table. Months that are left blank are considered "unfavorable" (or possibly "neutral") for treasuries.
Performance results using treasury bond futures
For testing purposes, we use a continuous futures contract from Bloomberg that tracks the daily performance of the 30-year treasury futures. For t-bond futures, each 1.00 point in price movement is worth $1,000.
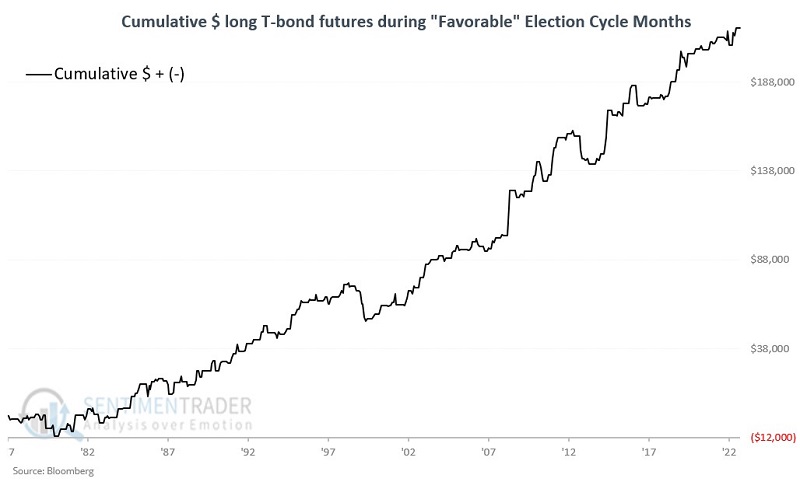
The chart below displays the hypothetical cumulative $ + (-) for t-bonds futures held long only during "favorable" months.
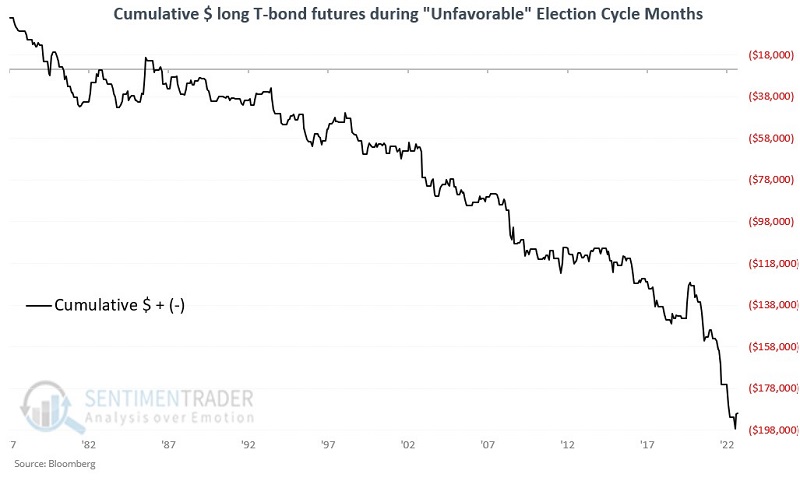
The chart below displays the hypothetical cumulative $ + (-) for t-bonds futures held long only during "unfavorable" months.
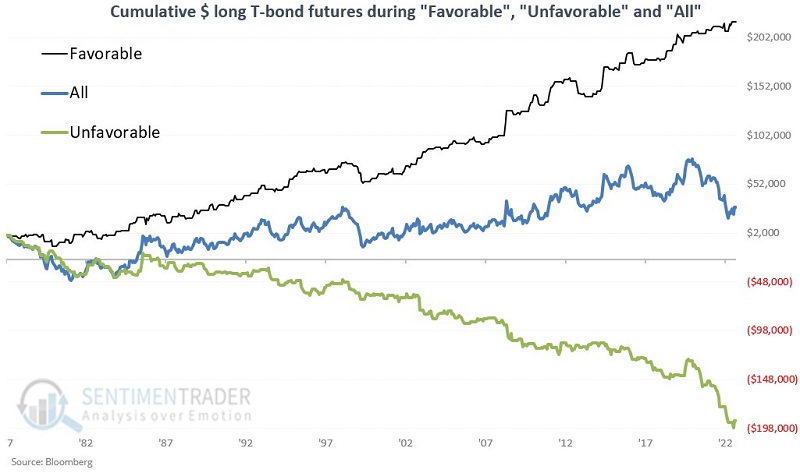
The chart below shows the hypothetical cumulative $ + (-) for t-bonds futures held long during "favorable," "unfavorable," and "all" months.
The table below displays a summary of performance during "all" months and a breakdown of performance during "favorable" and "unfavorable" months.
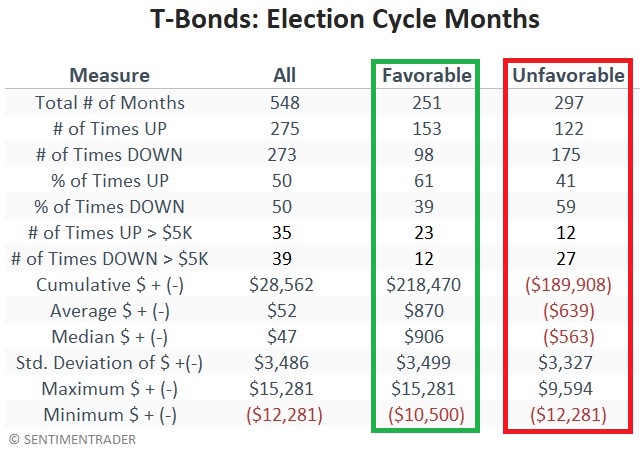
What the research tells us…
The election cycle calendar has done a reasonable job of avoiding significant declines in t-bond prices and of capturing gains. Nevertheless, it is not a "road map," Traders and investors should not look at the table above as a "trading system." One should not assume that any given "favorable" month will show a gain (historically, favorable months showed a decline 39% of the time, and the month of May 2023 started with one of the worst days for t-bonds in the past year).
Properly using the information presented here gives the bullish case the benefit of the doubt during "favorable" months - mainly if other indicators offer bullish confirmation. Likewise, the bearish case should be given the benefit of the doubt during "unfavorable" months - especially if other indicators are showing bearish confirmation.