
T-Bonds and Japanese Stocks, Inversely

In the financial markets, certain relationships hide in plain sight. For instance, there is a noticeable inverse relationship between U.S. treasury securities and the Japanese stock market. Most investors are unaware of this relationship because it simply "does not compute" for many individuals. And I would love to explain to you exactly "why" this relationship exists. But every time I explore the topic, I read about "the complex relationships" between such things as:
- The U.S. Dollar/Japanese Yen cross rate
- Interest rates in both Japan and the U.S.
- The "Yen Carry Trade"
- The relative state of the economy in both Japan and the U.S.
- Etc.
And typically, after a few minutes of such research, I begin to develop a headache and am reminded why most investors are unaware of this relationship. And then, luckily, I remember that as a proud graduate of "The School of Whatever Works" (good ole' SWW), when it comes to the markets, I am far less interested in "why" and far more interested in "how much" and "how often."
So, if you would like to fully research "why" the relationship I will detail below exists, well, the internet beckons, otherwise, let's get down to the heart of the matter.
TREASURY BONDS VERSUS TICKER EWJ
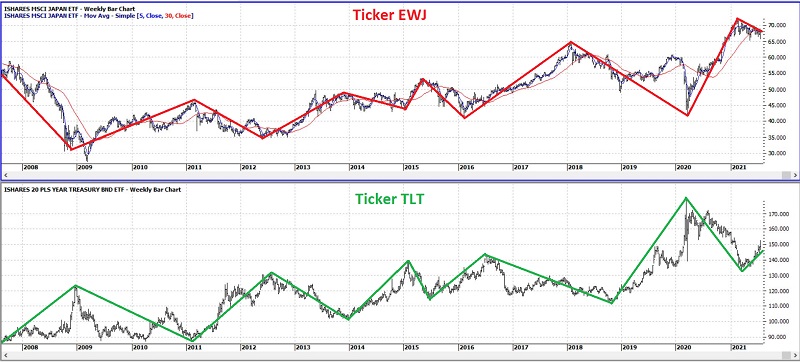
In the charts below (courtesy AIQ TradingExpert):
- The top clip displays a weekly chart of EWJ (iShares MSCI Japan ETF) - the iShares ETF that tracks a broad index of Japanese stocks - with a 5-week and 30-week moving average drawn
- The bottom clip displays a weekly chart of ticker TLT (iShares 20+ Year Treasury Bond ETF) - the iShares ETF that tracks the long-term U.S. Treasury bond
Note that - speaking in something less than highly technical terms - when one "zigs," the other tends to "zag."
The key thing to note in the charts above is the inverse correlation between the two - i.e.:
- When Japanese stocks advance, US treasuries tend to decline
- When Japanese stocks decline, U.S. treasuries tend to advance
For the record, the correlation coefficient in the last 2 years is -0.39 (1 means they trade the same, -1 means they trade exactly inversely).
For my purposes:
- If EWJ 5-week MA < EWJ 30-week MA = BULLISH for US treasuries
- If EWJ 5-week MA > EWJ 30-week MA = BEARISH for US treasuries
In other words:
- If the 5-week average for Japanese stocks is below the 30-week moving average, Japanese stocks are objectively designated as being in a downtrend, and vice versa
- A downtrend for Japanese stocks is deemed as bullish for treasury bonds, and an uptrend is deemed as bearish for treasury bonds
Any real merit to this fairly rudimentary form of analysis? In the chart below:
*The green line displays the hypothetical cumulative $ +(-) achieved by holding a long position in t-bond futures ($1,000 a point) when the EWJ indicator is BULLISH (for U.S. bonds)
*The red line displays the hypothetical cumulative $ +(-) achieved by holding a long position in t-bond futures ($1,000 a point) when the EWJ indicator is BEARISH (for U.S. bonds)
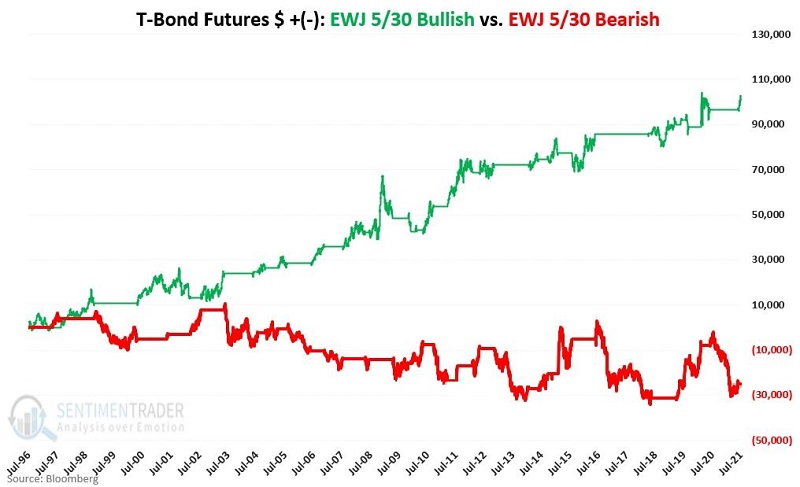
For the record, a long position held in t-bond futures (using purely hypothetical results with no slippage of commissions and based solely on changes in daily closing price data for 30-year treasury bond futures) held ONLY when:
- The EWJ 5-week average was below the EWJ 30-week average gained +$101,108 since 1996
- The EWJ 5-week average was above the EWJ 30-week average lost (-$25,127) since 1996
The most recent signal was the EWJ 5-week average moving BELOW the EWJ 30-week moving average on 6/11/2021. Since that time:
- T-bond futures have gained 4.375 points (or $4,375 per futures contract)
TICKER TLT FOR ETF TRADERS
For non-futures traders, in the chart below:
*The green line displays the hypothetical cumulative percentage price gain or loss achieved by holding a long position in ticker TLT when the EWJ indicator is BULLISH (for U.S. bonds)
*The red line displays the hypothetical cumulative percentage price gain or loss achieved by holding a long position in ticker TLT when the EWJ indicator is BEARISH (for U.S. bonds)
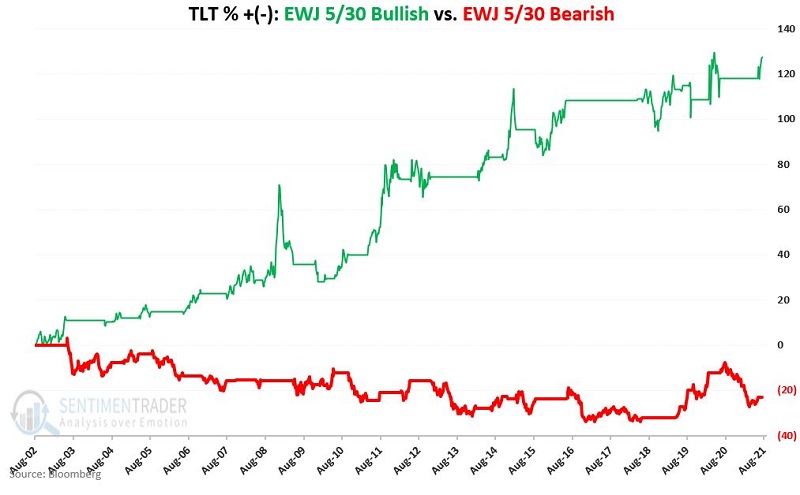
For the record, a long position held in the ETF ticker TLT (using purely hypothetical results with no slippage of commissions and based solely on changes in daily closing price data for TLT, NOT total return data) held ONLY when:
- The EWJ 5-week average was below the EWJ 30-week average gained +128% since 8/9/2002
- The EWJ 5-week average was above the EWJ 30-week average lost (-23%) since 8/9/2002
The most recent signal was the EWJ 5-week average moving BELOW the EWJ 30-week moving average on 6/11/2021. Since that time:
- Ticker TLT has gained +4.3%
SUMMARY
It is far too soon to "declare victory" regarding this most recent signal. And in fact, the real purpose of this piece is not to compel anyone to be bullish on bonds at this exact moment in time. The real purpose is to alert you to:
- A relationship that is hiding in plain sight (U.S. treasury securities and the Japanese stock market, inversely)
- A simple method that may help to keep you on the right side of the bond market more often than not