
Sustained Momentum Even As Cumulative Net New Highs Barely Budge

Sustained momentum
The McClellan Summation Index continues to power higher, showing impressive and sustained momentum. After being below -500 for at least 10 consecutive days, it is now above +500 for 10 straight, flipping its momentum.
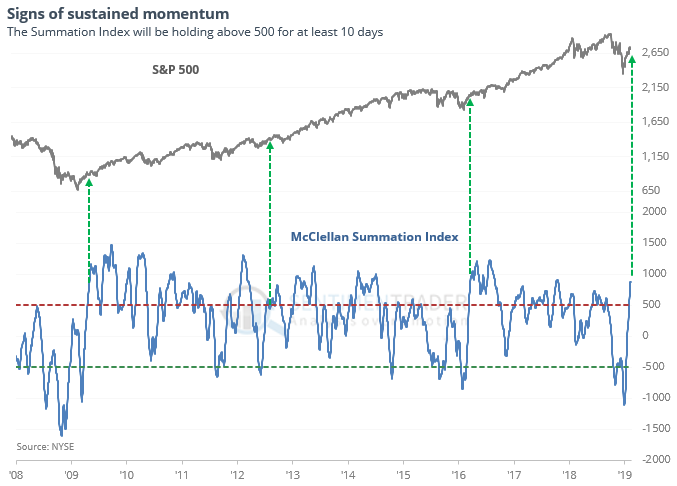
When it has been able to maintain a high level after flipping momentum since 1962, it has typically preceded markets with the kind of momentum that hasn’t rolled over.
Cumulative divergence
The Cumulative Advance/Decline Line is nearing its prior high, showing an impressive run of more advancing stocks than declining ones. But the Cumulative New High / New Low Line has barely budged.
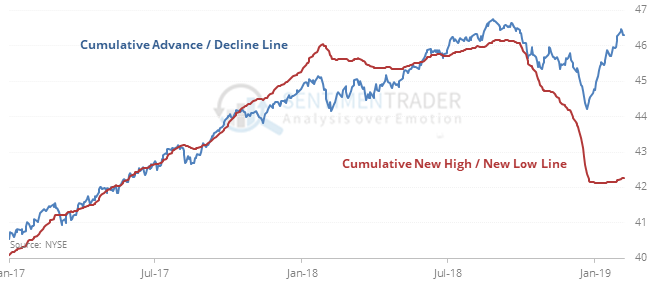
That could suggest a troubling divergence, but when this has happened before, it was a good sign for stocks.
Options traders return
While still not to an extreme, small options traders bought quite a few more calls last week, pushing the ROBO Put/Call Ratio down significantly. Overall, traders executed 22% more bullish options strategies than bearish ones, the most since September.
Nice move
Heading into this week, 100% of S&P 500 Utilities stocks were trading above their 50-day moving averages. The Backtest Engine tells us that when this happens for the first time in at least 3 months, XLU rallied over the next two weeks only 38% of the time.
This post was an abridged version of our Daily Report. For full access, sign up for a 30-day free trial now.