Products
SentimenTrader Trading Tools
‍
Backtest Engine
My Trading Toolkit
Correlation Analysis
Seasonality
Market Prediction
Indicators & Data API
‍
Proprietary Indicators & Charts
Market Data API
Strategies & Scanner
‍
50+ Trading Strategies
Smart Stock Scanner
Smart Option Scanner
Research Reports
‍
Research Solutions
Reports Library
Free Resources
Simple Backtest Calculator
Simple Seasonality Calculator
The Kelly Criterion Calculator
Sentiment Geo Map
Public Research Reports
Education
Sentiment Indicators
Technical Indicators
Pricing
Company
About
In the News
Testimonials
Client Success Stories
Contact
Log inLoginSign up
< BACK TO ALL REPORTS

Survey Pessimism Pushes AIM Model To Low Level

Jason Goepfert
2016-02-11
null

With the latest survey results from the American Association of Individual Investors, most of the sentiment surveys we follow are showing extremely low levels of optimism.

As noted in last night's Report, the percentage of bears in some of them are not at "panic" levels, so there's that. It's mostly a historic lack of bullishness more than a high level of bearishness.

Because stocks have an upward drift, it's more rare to see extremely high levels of bearish opinion, and it's a better indicator of an imminent low in stocks. We're not seeing that yet.

Still, the overall depressed nature of the bulls will push the AIM Model down to 3%, one of its lowest readings ever. Because surveys were a lot more volatile prior to the past 30 years, we prefer to focus on more recent history, though as noted yesterday that introduces a more positive bias to the results as well.

Here are the returns in the S&P every time the AIM Model first dropped to 3% or below for the first time in at least three months.

20160211_aim_spx

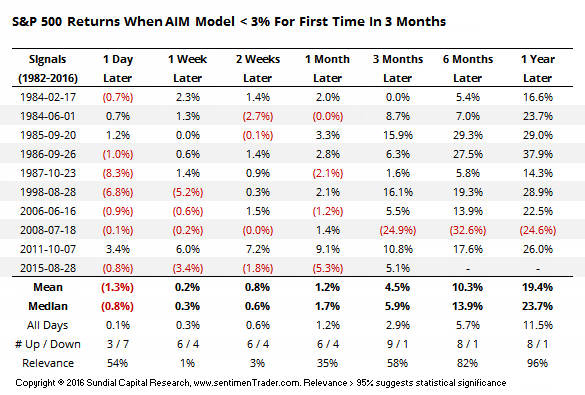
Clearly a positive bias, particularly in the medium- to longer-term. The only negative returns were from July 2008, though they were severe.

Stocks are indicated to open badly once again today, so here are the returns in the S&P 500 futures from the opening print of any day that they gapped down at the open by at least -1% and the AIM Model was at 5% or below:

20160211_aim

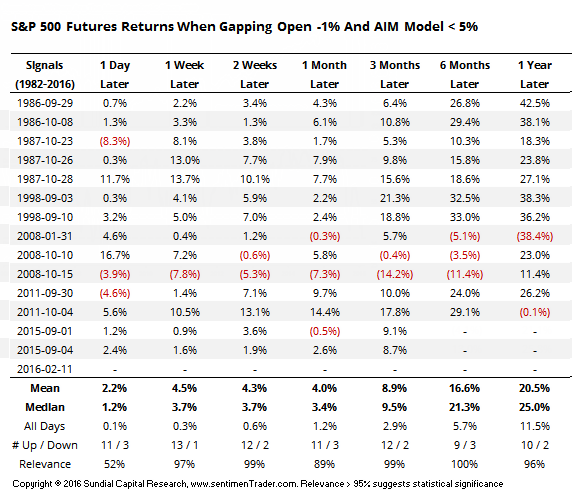
Here the results are more positive on a shorter-term basis, especially over the next 1-2 weeks. Buying into a gap down like this, with many stocks and sectors plumbing new lows, is a scary idea. Typically, if there is to be a multi-day or multi-week rebound, then we'll see an intraday reversal or "tweezer" type of pattern where the next day more than makes up for the day of the decline. That helps to reduce the probability that we get sucked into a crash-type of decline where extremes simply don't matter.

PRODUCTS
SentimenTrader
Trading Tools
Indicators & Data API
‍
Strategies & Scanner
‍
Research Reports
FREE
RESOUrCES
Simple Backtest
Calculator
Simple Seasonality
Calculator
The Kelly Criterion
Calculator
Sentiment Geo Map
‍
Public Research Reports
‍
Education
Sentiment Indicators
‍
Technical Indicators
‍
Pricing
Bundle pricing
‍
FAQ
‍
Announcements
‍
COMPANY
‍
About
‍
In the News
‍
Testimonials
‍
Client Success Stories
CONTACT
‍
General Inquiries
‍
Media Inquiries
‍
Financial Professionals Inquiries
‍
© 2026 Sundial Capital Research Inc. All rights reserved.
Setsail Marketing
TermsPrivacyAffiliate Program
Risk Disclosure: The information and tools provided are for research and analytical purposes only and are not intended as investment advice. Market analysis involves uncertainty, and outcomes may differ from expectations. Users should conduct their own due diligence and consider their individual circumstances before making any financial decisions. Past performance is not necessarily indicative of future results.

Hypothetical Performance Disclosure: Hypothetical performance results have many inherent limitations, some of which are described below. No representation is being made that any account will or is likely to achieve profits or losses similar to those shown; in fact, there are frequently sharp differences between hypothetical performance results and the actual results subsequently achieved by any particular trading program. One of the limitations of hypothetical performance results is that they are generally prepared with the benefit of hindsight. In addition, hypothetical trading does not involve financial risk, and no hypothetical trading record can completely account for the impact of financial risk of actual trading. for example, the ability to withstand losses or to adhere to a particular trading program in spite of trading losses are material points which can also adversely affect actual trading results. There are numerous other factors related to the markets in general or to the implementation of any specific trading program which cannot be fully accounted for in the preparation of hypothetical performance results and all which can adversely affect trading results.

Testimonial Disclosure: Testimonials appearing on this website may not be representative of other clients or customers and is not a guarantee of future performance or success.