
Surging real yields and the impact on assets

Key points:
- The real rate on 10-year Treasuries broke out to a 3-year high and has kept climbing
- Breakouts in real rates have been a modest drag on stock prices over the next couple of months
- Other assets, especially gold and miners, struggled, while defensive sectors held up best
Real rates keep rising, and it's a real issue
The Wall Street Journal notes that rising rates are increasingly becoming an issue for investors. This pretty much sums up the thought process:
A lot of investors chose to take risk in the equity market because there was no return available anywhere else. Now's the time where people are thinking, ‘Do I really need to take that risk?" said Katie Nixon, chief investment officer of Northern Trust Wealth Management.
Based on the number of news articles concerning the term "interest rates," recent months have seen the most interest investors have shown in a decade. The number of articles has been about half again as numerous as the last time rates marched higher during 2016-17.
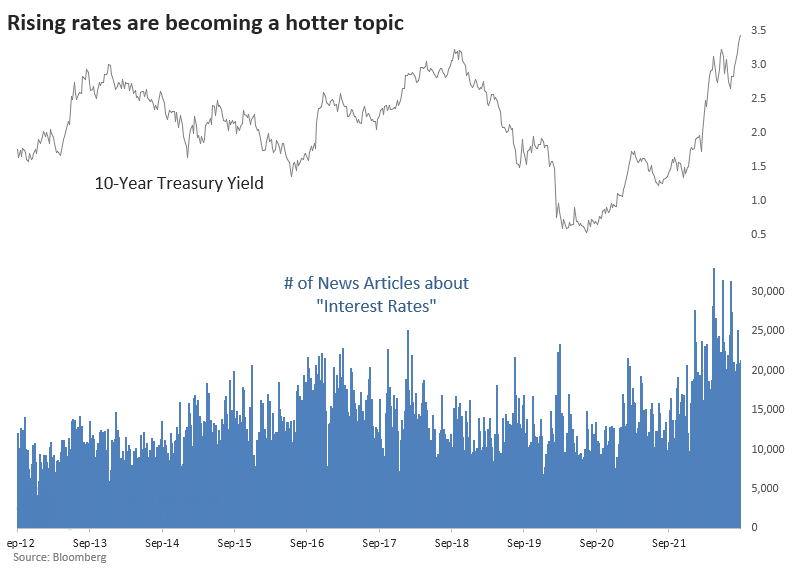
Most consumers and investors are more concerned with real rates, whether they realize it or not. This is the rate of the 10-year Treasury yield minus the 10-year breakeven rate, roughly a gauge of investors' long-term inflation expectations. This real yield has been spiking and is nearing an 11-year high.
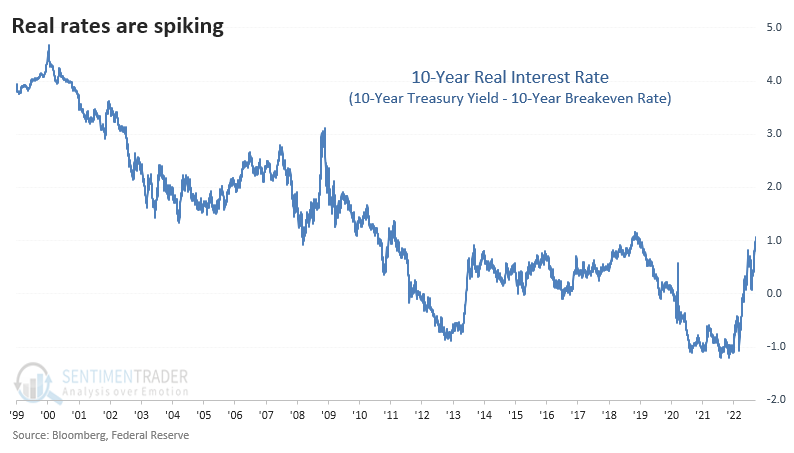
The rate spiked to a fresh three-year high a couple of weeks ago and has kept climbing. Before 1999, we need to use an alternative data source, which uses core CPI to reflect inflation. It's imperfect, to be sure, and is more volatile.
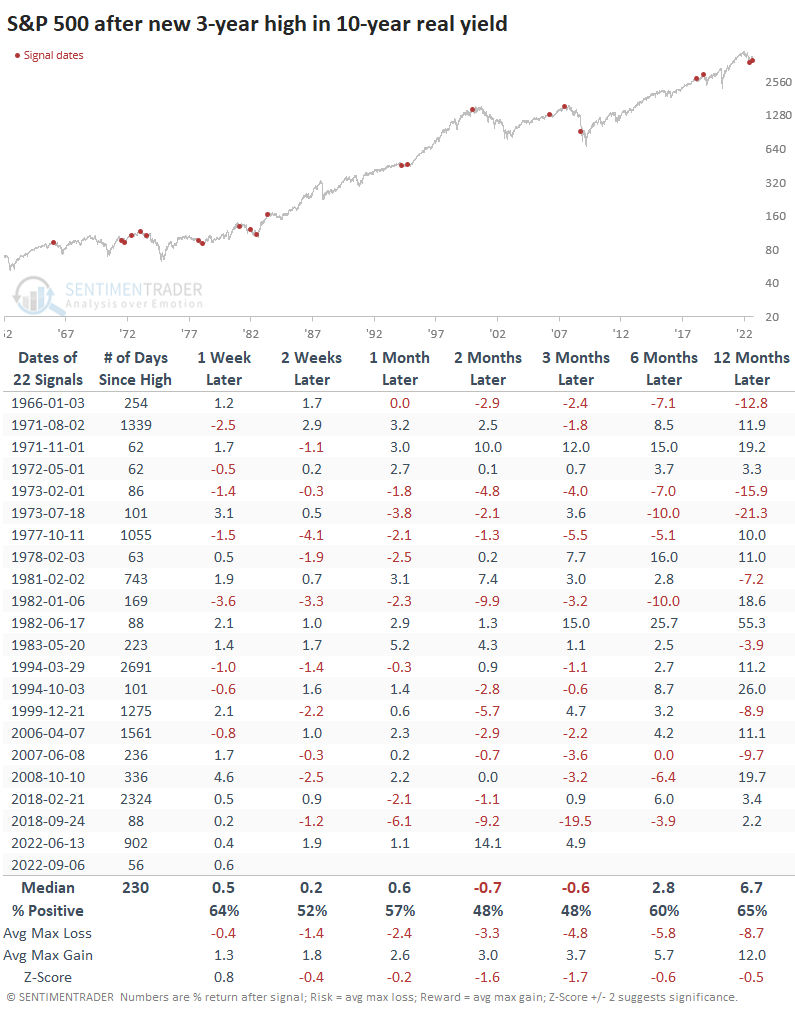
Whenever the real rate broke out to a new multi-year high for the first time in months, the S&P 500 struggled a bit over the next 2-3 months. Returns over the past 30 years were fragile in that time frame.
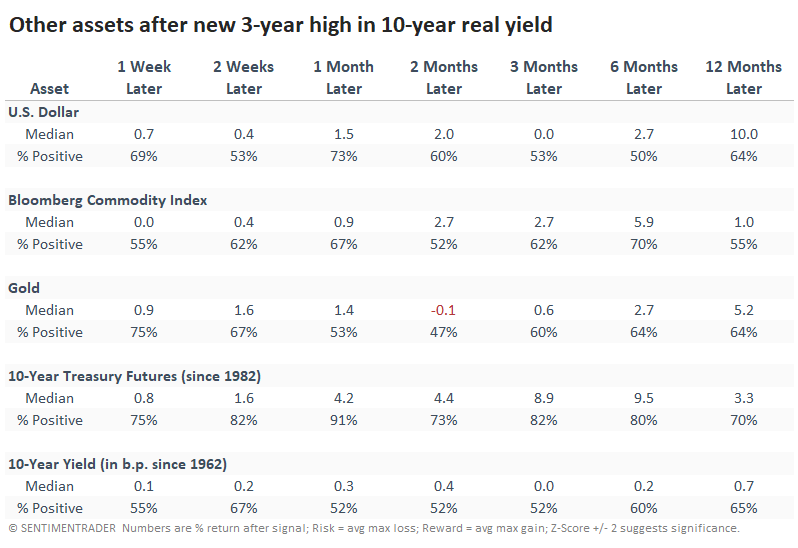
Other assets showed mixed performance
One of the charts that often zooms around is the 10-year real rate superimposed against gold, with one of them inverted. Rising real rates have been a killer for gold prices over the past 15 years. Before that, the relationship wasn't as strong, particularly during the mid-2000s.
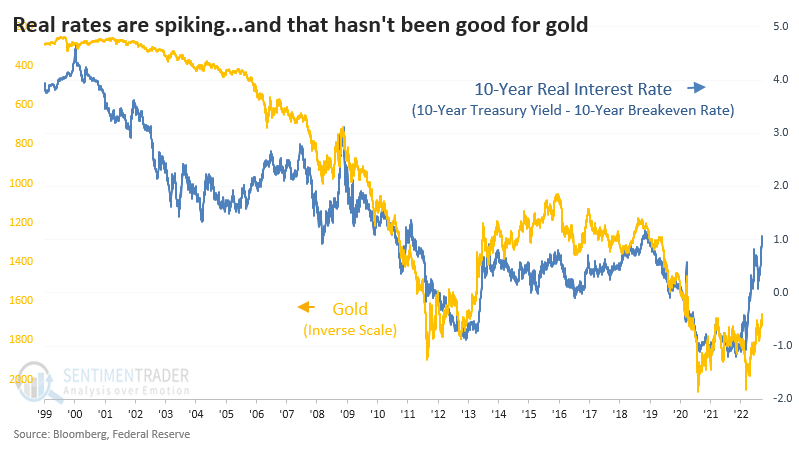
If we use the signal dates above, when real rates broke out to a new 3-year high, we can look at returns in other asset classes. Gold was the only one that showed losses more often than gains over the next couple of months, but even that wasn't egregious.
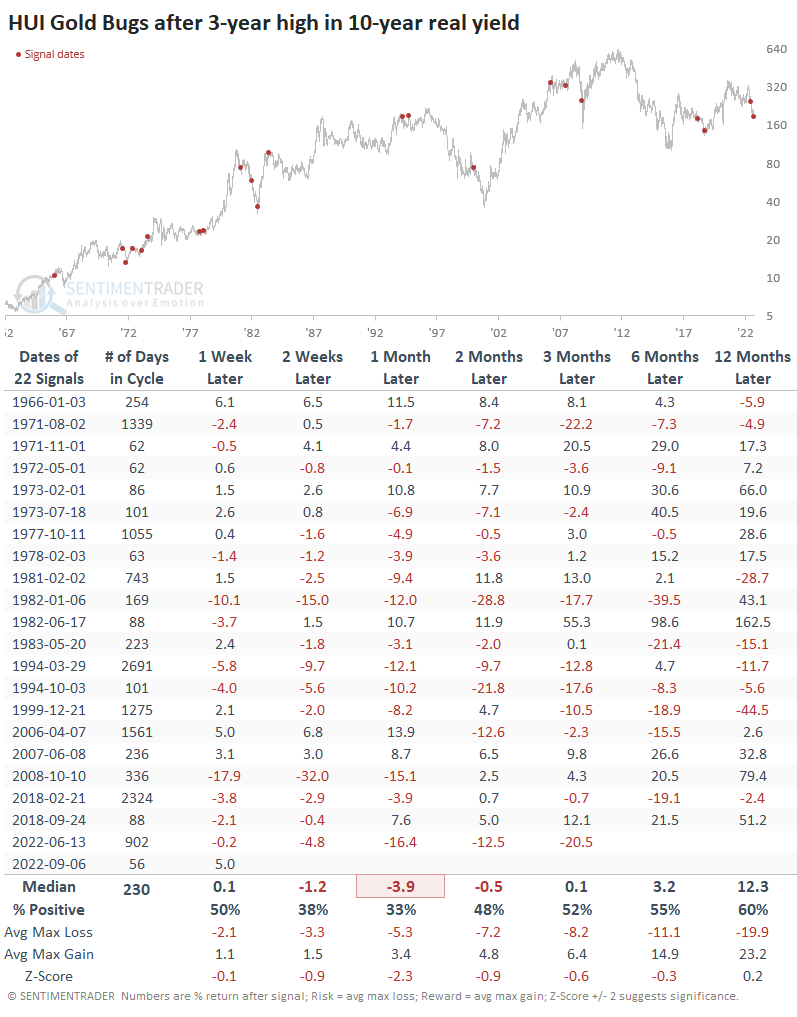
Instead of the price of gold, if we look at the HUI Gold Bugs Index, returns were pretty bad over the next couple of months. Over the past 40 years, the index suffered a negative return between 2-8 weeks later 11 out of 13 times.
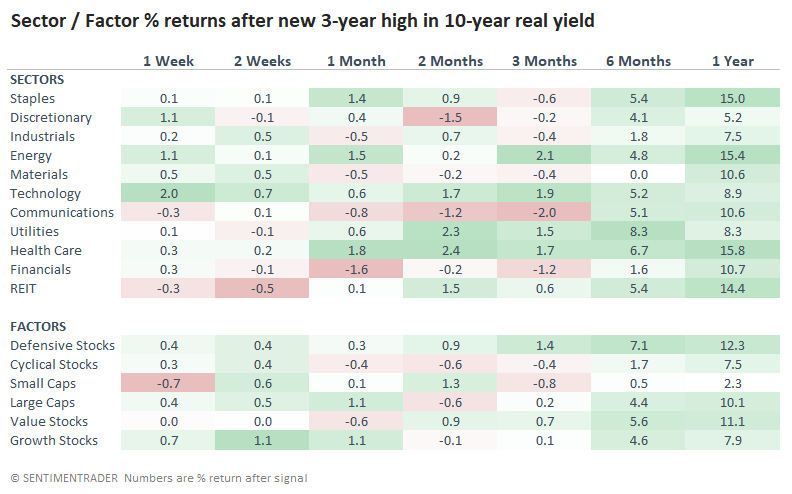
Looking at sectors and factors, most were weak over the medium-term and decent over the longer term. The more defensive ones tended to show more robust returns. Small-caps did not.
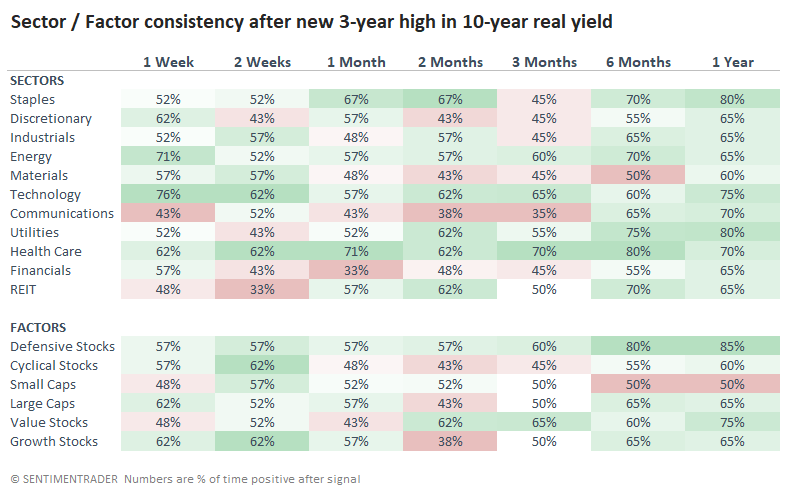
The table below reflects the same signals, but the percentage of time each sector or factor showed a positive return. It has mostly the same implications, but it's interesting to see how often the surge in real rates impacted those medium-term returns.
What the research tells us...
We don't do a lot of global macro analysis here because it's the type of guessing that probably has the worst track record of any approach. If you happen to guess right (maybe 20% of the time?), it can work wonders. But almost nobody can do it consistently, and those that can probably aren't selling their insights or posting them for free on Twitter.
Objectively looking at other breakouts in real rates, it was a modest drag on stock prices, though defensive sectors tended to hold up well. Gold has had a strong inverse correlation in recent decades but not necessarily before that, and by the time rates broke to new highs, it was sometimes already ready to reverse.