
Summer months and the stock market

Key points
- As we enter June, should we expect a "summer rally" or "the summer doldrums?"
- History offers some relevant clues
- Summer months generally tend to perform better during presidential election years
Entering the summer months
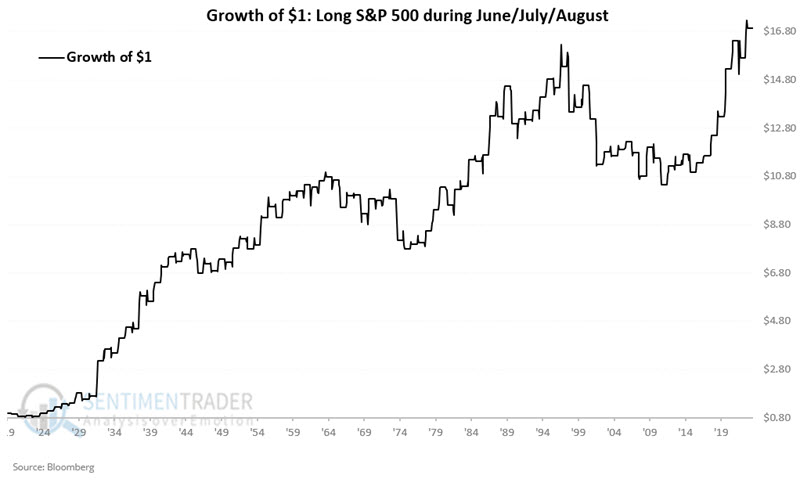
The old market adage of "Sell in May and Go Away" has likely caused a bias in many investors' thinking. Many seem to think of the summer months as a quiet, relatively sleepy period for the stock market, with something of a negative bias. But is this reality?
The chart below displays the hypothetical growth of $1 invested in the S&P 500 Index only during the months of June, July, and August every year starting in 1920.
Focusing on Presidential Election Years
Since we are in a presidential election year, we will focus on historical stock market performance during June, July, and August of presidential election years.
JUNE:
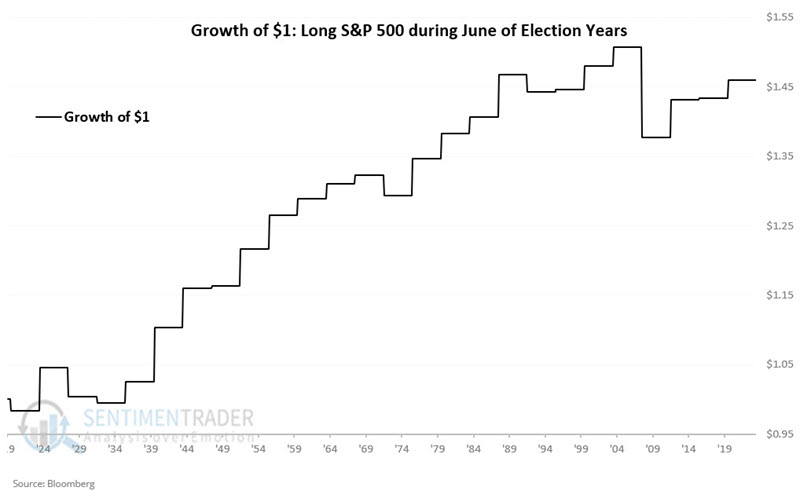
The chart below displays the growth of $1 invested in the S&P 500 only during June of election years.
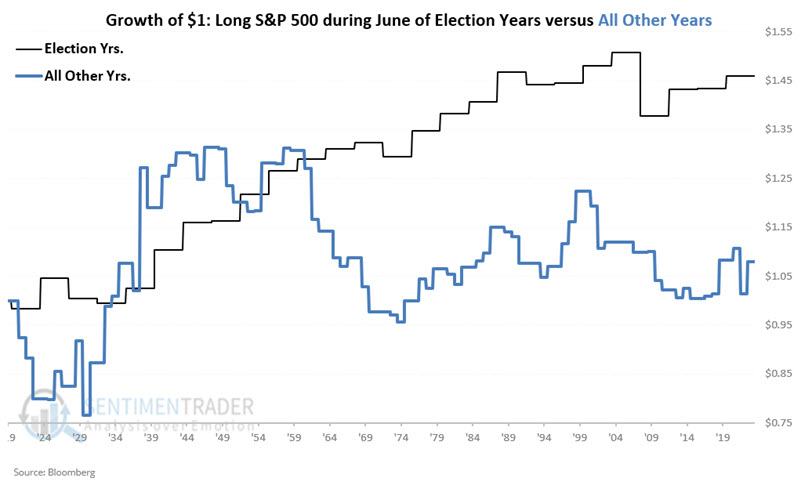
The chart below displays the same information as the chart above and compares its performance during June during the other three years of the election cycle. June of election years outperformed all other years combined.
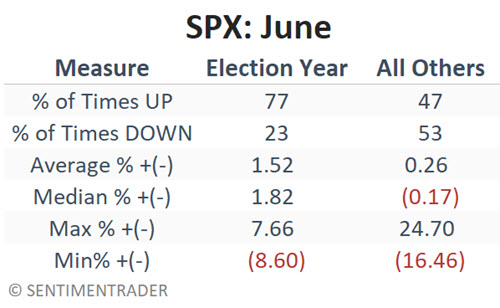
The table below summarizes June's performance during election years versus all other years.
JULY:
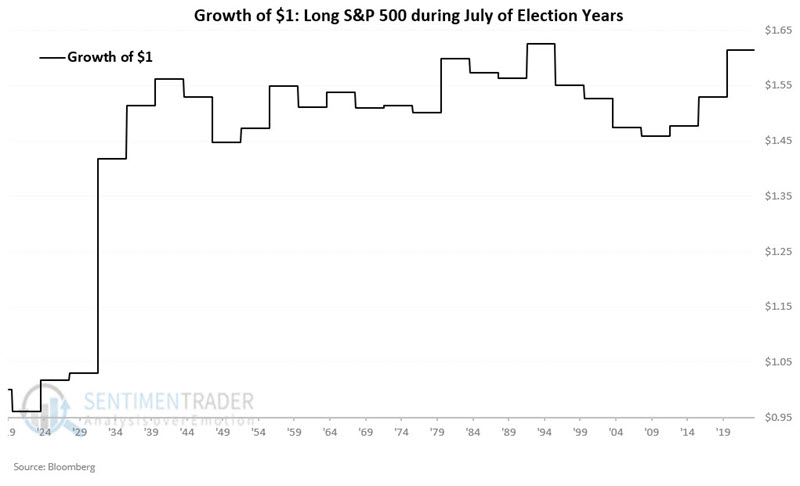
The chart below displays the growth of $1 invested in the S&P 500 only during July of election years.
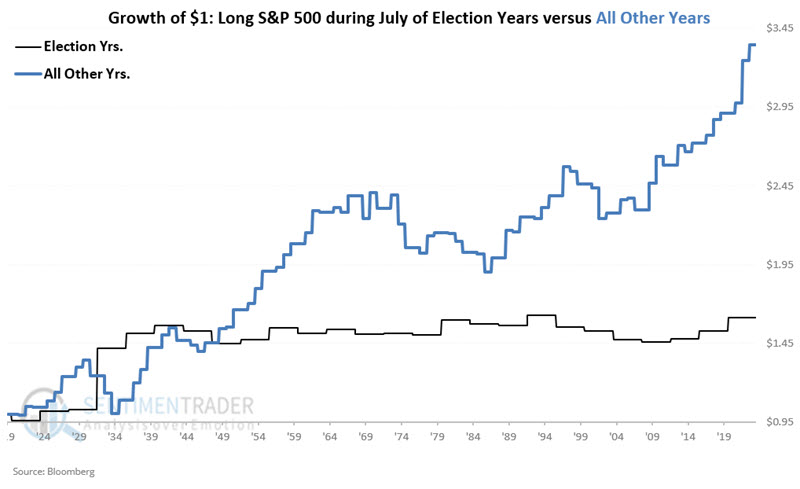
The chart below displays the same information as the chart above and compares its performance during July during the other three years of the election cycle. Stock market performance during July of election years has been subpar.
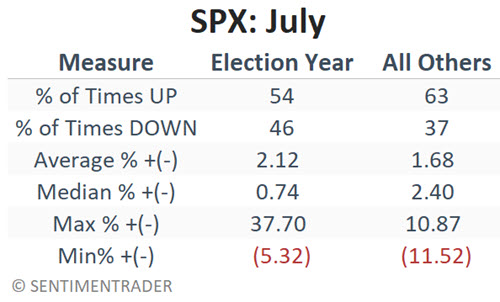
The table below summarizes July's performance during election years versus all other years.
AUGUST:
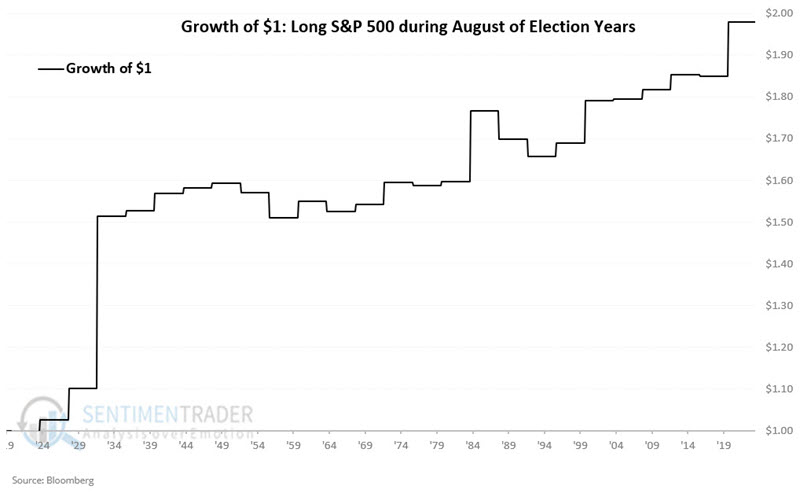
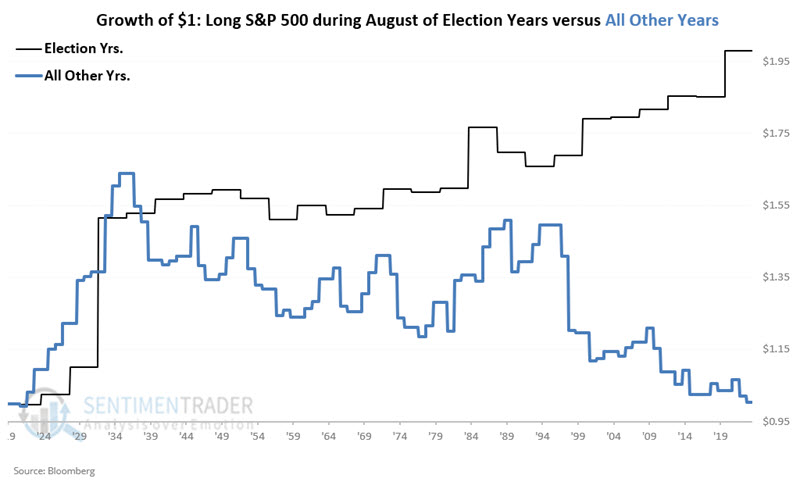
The chart below displays the growth of $1 invested in the S&P 500 only during August of election years.
The chart below displays the same information as the chart above and compares its performance during August during the other three years of the election cycle. August of election years has seen much better overall performance than during other years within the election cycle.
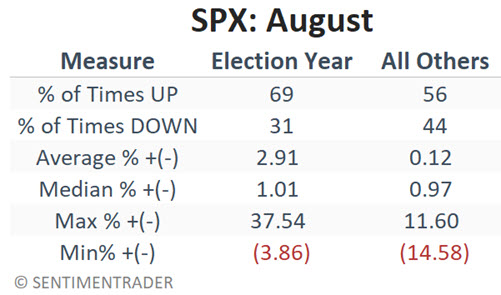
The table below summarizes July's performance during election years versus all other years.
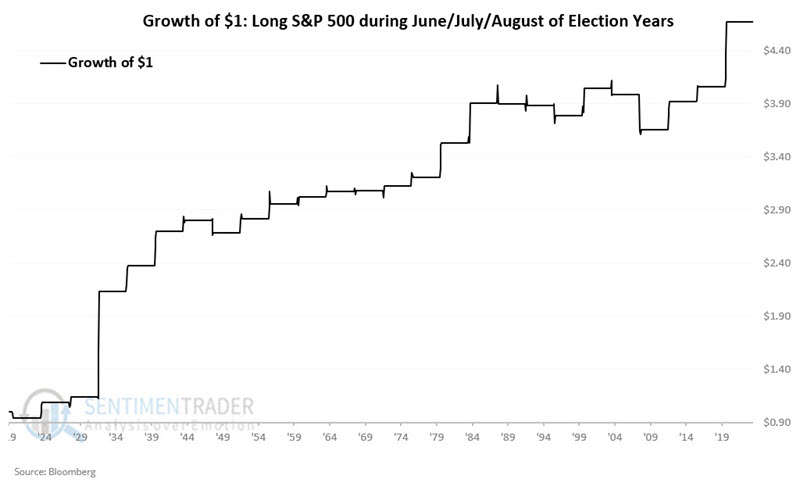
Taking all three months together
Now, let's combine the three months into one combined three-month period. The chart below displays the growth of $1 invested in the S&P 500 only during June, July, and August of election years.
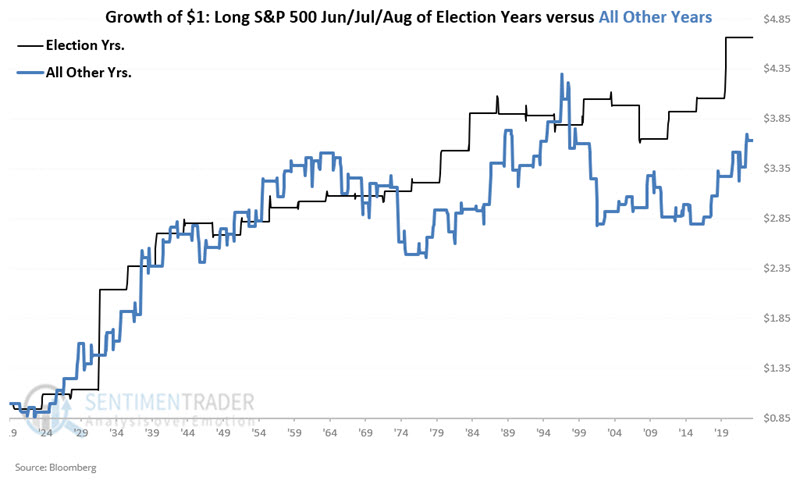
The chart below displays the same information as the chart above and compares its performance during the other three years of the election cycle. Historically, the summer months during the election year have performed better and more consistently than the summer months of all other years.
The table below summarizes summer month performance during election years versus all other years.
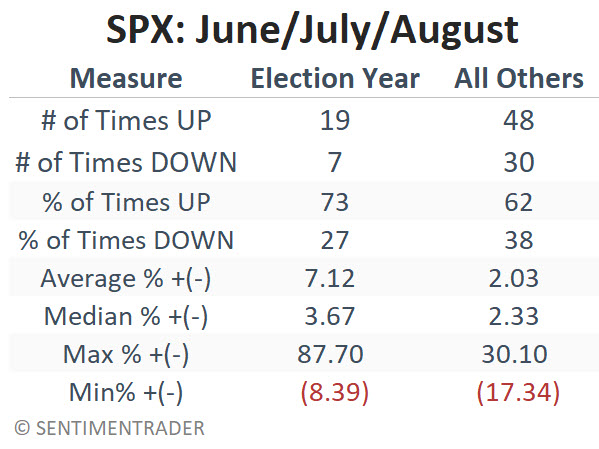
What the research tells us…
The June through August period has shown a gain of 73% of the time during presidential election years since 1920. This is well above the 62%-win rate for the summer months during other years. Likewise, the average and median gain have been higher during election years. Another thing to note is that the maximum three-month net loss during the summer months in an election year was -8.39%. Could the stock market perform poorly in the months ahead? Of course. However, history suggests that defensive thoughts based solely on the narrative that "the summer months are iffy for stocks" appear misguided.