Data &
Technology
Research
Reports
Report Solutions
Reports Library
Actionable
Strategies
Free
Resources
Simple Backtest Calculator
Simple Seasonality Calculator
The Kelly Criterion Calculator
Sentiment Geo Map
Public Research Reports
Free Webinar
Pricing
Company
About
Meet Our Team
In the News
Testimonials
Client Success Stories
Contact
Log inLoginSign up
< BACK TO ALL REPORTS

Summation Indexes show complete recovery from devastation

Jason Goepfert
2020-06-03
The rally has been sustained and broad enough that the McClellan Summation Index has moved above +500 after hitting -1000 during the panic. When it cycles like this within two months, forward returns were excellent. There have also been recoveries in high-yield bonds and overseas indexes like the DAX, and even emerging markets.

The rally has lasted long enough, and has been widespread enough, that longer-term breadth measures are recovering from their March devastation.

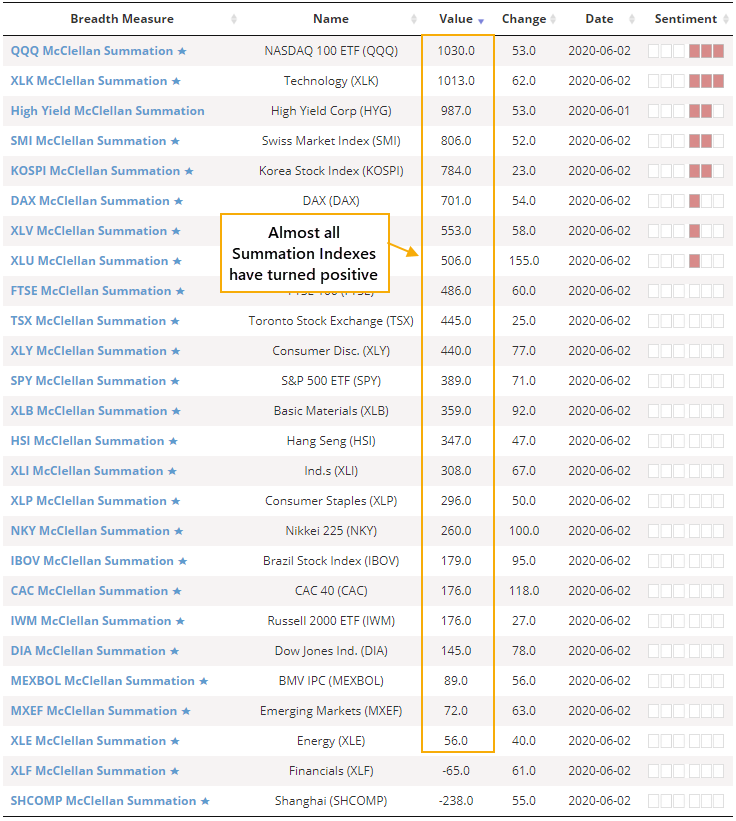
According to the Sector Breadth page, almost all major indexes, domestic and overseas, now have a positive McClellan Summation Index.


The Summation Index is based on work pioneered by Sherman and Marian McClellan. It is a longer-term look at the momentum of the underlying breadth of an index, adding each day's McClellan Oscillator reading to the day before. When it is above zero, momentum is positive; below zero, it is negative. 

On the NYSE, the Oscillator has been gyrating but has recorded some very high readings over the past two months. That has pushed the longer-term Summation Index above +500 for the first time in months, following its plunge below -1000.

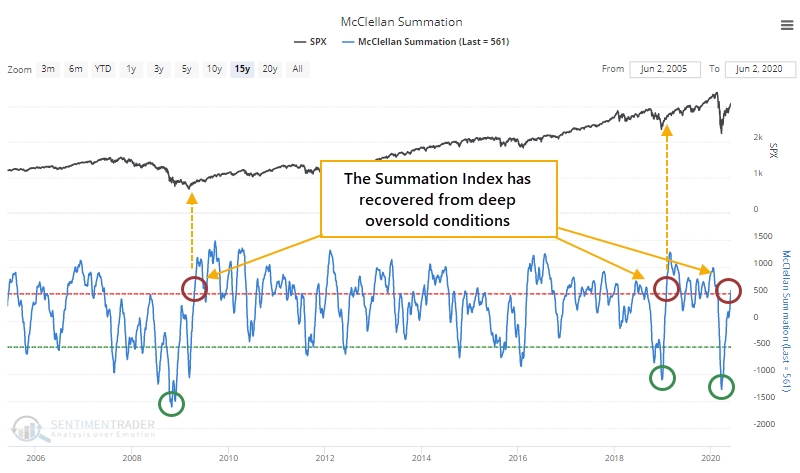
When the Summation Index has recovered from below -1000 to above +500, it has typically preceded sustained recoveries in the S&P 500.

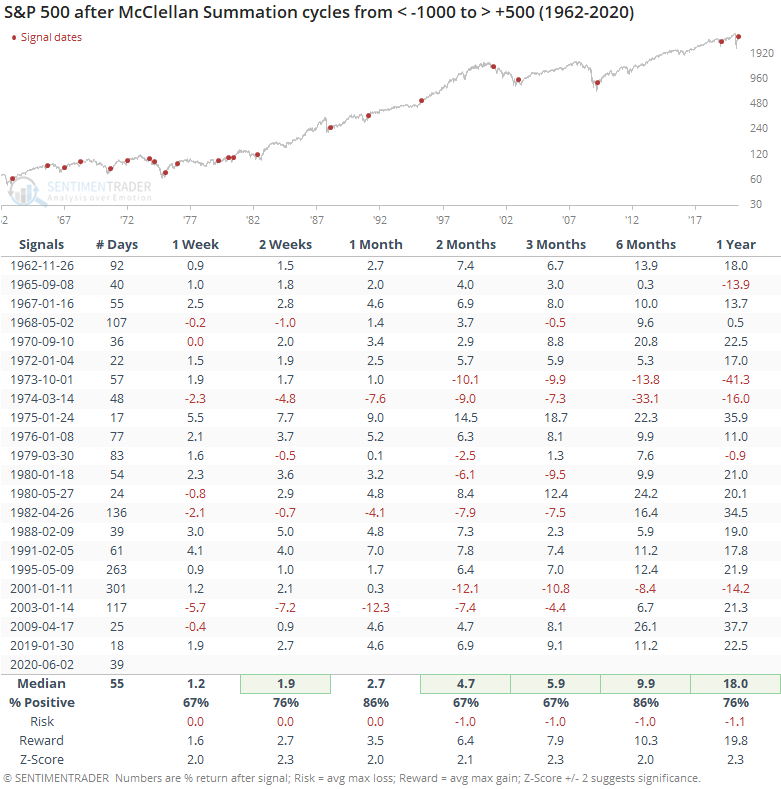
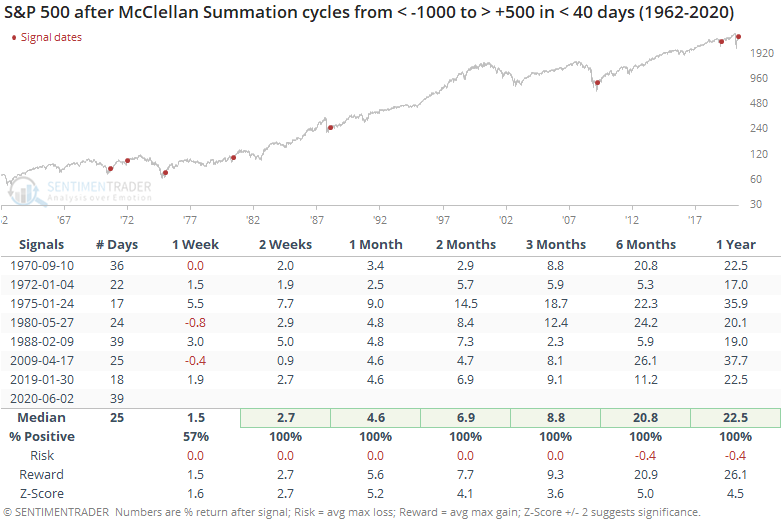
One of the keys here, though, is how quick the recovery has been. The Summation Index completed its cycle in only 39 trading days, among the fastest since 1962. If we filter the table to only include those cycles that completed within two months, then forward returns were even more impressive. We should always beware of anything that claims perfection, but these results were...perfect.

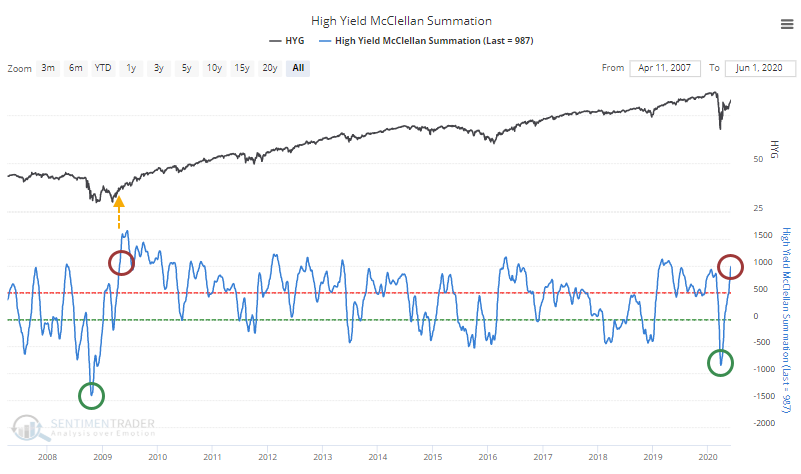
What makes this recovery more impressive is how broad it is. Not just within the S&P 500 or even the NYSE, but across markets and across regions. The Summation Index for high-yield bonds has fully cycled as well, with 2009 being the only precedent.


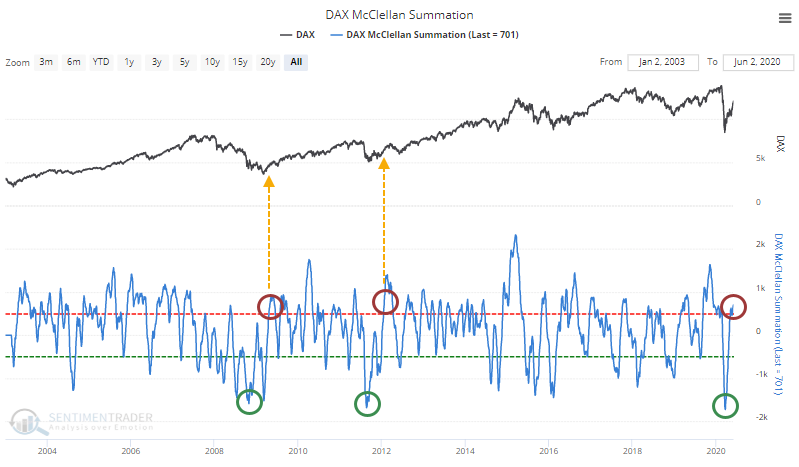
We've seen signs that investors have soured on overseas markets, pulling massive amounts from funds, with even large money managers avoiding them.

Yet markets like the German DAX are seeing a long-term breadth recovery. The only other times the Summation Index for the DAX cycled like this were April 2009 and January 2012, both leading to large, sustained gains.

The Summation Index for emerging markets is even recovering, rising above zero after recording a record low reading.

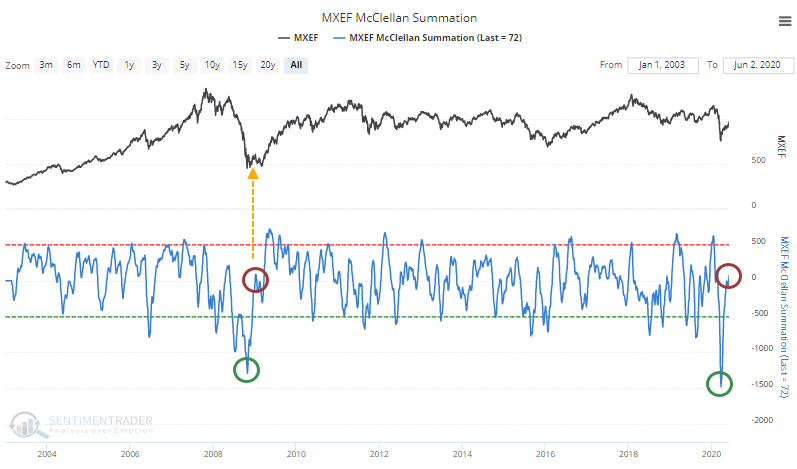
Most other markets are showing similar gains, with similar repercussions.

Like the other signs of breadth recovery and historic thrusts that we've looked at, it's hard to ignore this. Investors always face the same struggle - okay, this looks great, but now I have to buy into a rising market. Outside of pure momentum traders, this is a difficult ask. Ideally, we'd see some kind of medium-term digestion to work off signs of shorter-term speculation and overbought conditions, but markets aren't obliged to accommodate our ideals.

DATA &
TECHnologies
IndicatorEdge
‍
BackTestEdge
‍
Other Tools
‍
DataEdge API
RESEARCH
reports
Research Solution
‍
Reports Library
‍
actionable
Strategies
Trading Strategies
‍
Smart Stock Scanner
‍
FREE
RESOUrCES
Simple Backtest
Calculator
Simple Seasonality
Calculator
The Kelly Criterion
Calculator
Sentiment Geo Map
‍
Public Research Reports
‍
Free Webinar
COMPANY
‍
About
‍
Meet our Team
‍
In the News
‍
Testimonials
‍
Client Success Stories
Pricing
Bundle pricing
‍
Announcements
‍
FAQ
© 2024 Sundial Capital Research Inc. All rights reserved.
Setsail Marketing
TermsPrivacyAffiliate Program
Risk Disclosure: Futures and forex trading contains substantial risk and is not for every investor. An investor could potentially lose all or more than the initial investment. Risk capital is money that can be lost without jeopardizing ones’ financial security or life style. Only risk capital should be used for trading and only those with sufficient risk capital should consider trading. Past performance is not necessarily indicative of future results.

Hypothetical Performance Disclosure: Hypothetical performance results have many inherent limitations, some of which are described below. No representation is being made that any account will or is likely to achieve profits or losses similar to those shown; in fact, there are frequently sharp differences between hypothetical performance results and the actual results subsequently achieved by any particular trading program. One of the limitations of hypothetical performance results is that they are generally prepared with the benefit of hindsight. In addition, hypothetical trading does not involve financial risk, and no hypothetical trading record can completely account for the impact of financial risk of actual trading. for example, the ability to withstand losses or to adhere to a particular trading program in spite of trading losses are material points which can also adversely affect actual trading results. There are numerous other factors related to the markets in general or to the implementation of any specific trading program which cannot be fully accounted for in the preparation of hypothetical performance results and all which can adversely affect trading results.

Testimonial Disclosure: Testimonials appearing on this website may not be representative of other clients or customers and is not a guarantee of future performance or success.