Data &
Technology
Research
Reports
Report Solutions
Reports Library
Actionable
Strategies
Free
Resources
Simple Backtest Calculator
Simple Seasonality Calculator
The Kelly Criterion Calculator
Sentiment Geo Map
Public Research Reports
Free Webinar
Pricing
Company
About
Meet Our Team
In the News
Testimonials
Client Success Stories
Contact
Log inLoginSign up
< BACK TO ALL REPORTS

Style and Sector Performance 1-Year after the Pandemic Low

Dean Christians
2021-03-24
Let's review style and sector performance on the pandemic low's first anniversary to see how the most recent results compare to history.

As many of you know, the team at sentimentrader.com is a big proponent of studying market history to find an information edge. While every business cycle is different, certain styles and sectors perform better than others in the early stage of a new cycle. On Tuesday, the market celebrated the first anniversary of the pandemic low. Let's review performance for several styles and sectors to see how the most recent early cycle phase compares to history.

Mark Twain was credited with saying, "History does not repeat, but it often rhymes." 

Let's see for ourselves.

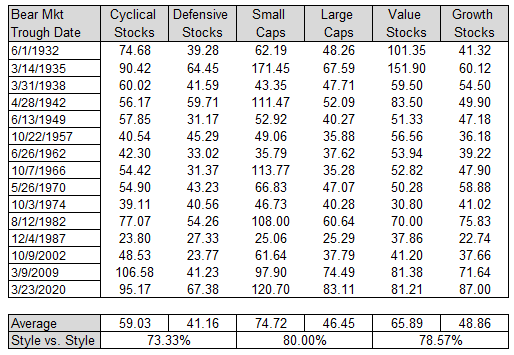
Style Performance (% Total Return)

Cyclical vs. Defensive - Cyclical stocks have outperformed defensive issues 73.33% of the time one year post a bear market bottom, and this time was no different. The group also registered the second-best absolute performance in history.

Small-Cap vs. Large Cap - Small stocks have outperformed large-cap issues 80% of the time one year post a bear market bottom, and this time was no different. The group also registered the second-best absolute performance in history.

Value vs. Growth - Value stocks have outperformed growth issues 78.57% of the time one year post a bear market bottom. However, this time they underperformed growth. Growth stocks registered their best performance in history.

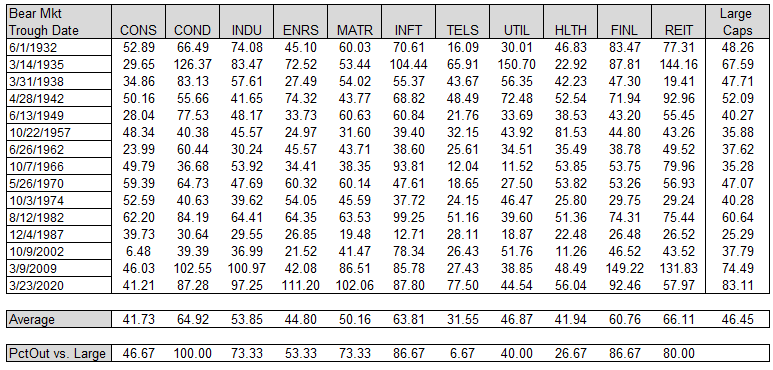
Sector Performance (% Total Return)

The traditional early cycle leaders like Consumer Discretionary, Industrials, Technology, Financials, and Materials all performed as one would expect during the first year. Consumer Discretionary maintained its perfect record of outperforming versus large-cap stocks. As expected, the traditionally defensive sectors underperformed. The one big surprise was the noticeable outperformance in the energy group, as it normally performs in line during the early cycle phase. The energy group was ripe for a mean reversion pop, as we will see in a chart at the end of the note.

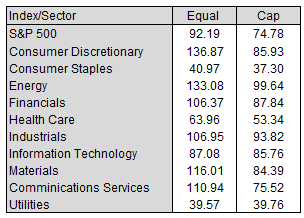
Equal-Weight Sector Performance (% Price Return)

Large-Cap equal-weighted indexes and sectors traditionally outperform the cap-weighted version, and this time was no different.

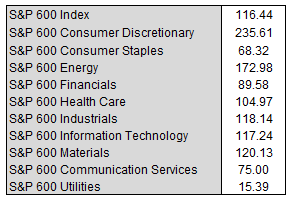
Small-Cap Sector Performance (% Price Return)

Small-cap discretionary stocks were nothing short of spectacular. The 235.61% gain easily beat the 142.90% gain they registered from the March 2009 low. Energy also registered the best performance from a low in history.

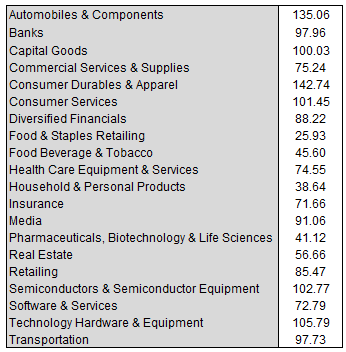
All-Cap Industry Group Performance (% Price Return)

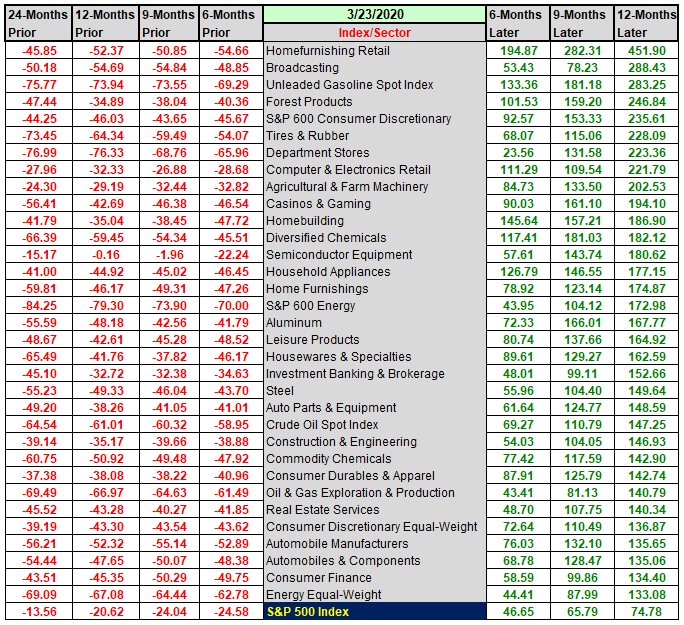
All-Cap Sub-Industry Performance (% Price Return)

I monitor the following table whenever the market is in a major correction or bear market for mean reversion opportunities. As one can see, some of the most beaten-down groups performed the best off the 3/23 low. The energy group was clearly a beneficiary of a major oversold condition.

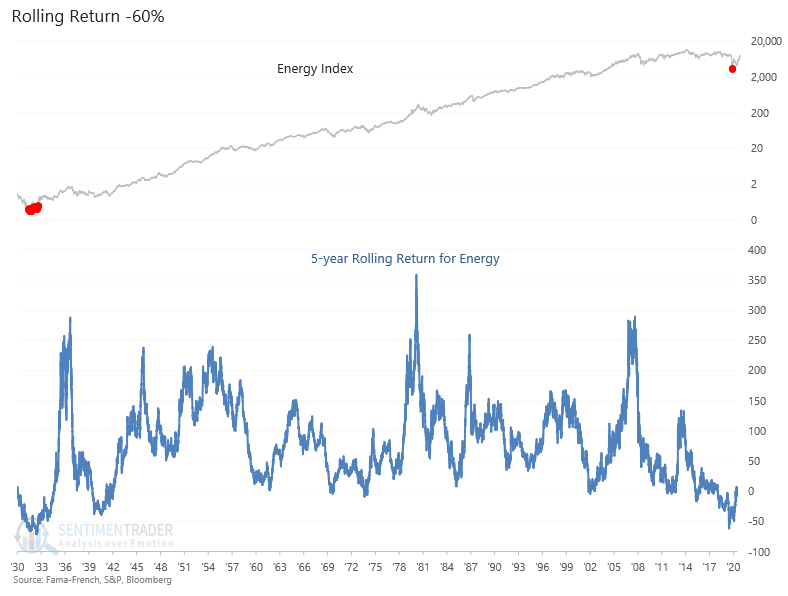
Energy Mean Reversion Chart (Total Return)

The energy sector was ripe for a mean reversion trade as it reached an oversold level not seen since 1932.


Sorry, you don't have access to this report

Upgrade your subscription plan to get access
Go to Dasboard
DATA &
TECHnologies
IndicatorEdge
‍
BackTestEdge
‍
Other Tools
‍
DataEdge API
RESEARCH
reports
Research Solution
‍
Reports Library
‍
actionable
Strategies
Trading Strategies
‍
Smart Stock Scanner
‍
FREE
RESOUrCES
Simple Backtest
Calculator
Simple Seasonality
Calculator
The Kelly Criterion
Calculator
Sentiment Geo Map
‍
Public Research Reports
‍
Free Webinar
COMPANY
‍
About
‍
Meet our Team
‍
In the News
‍
Testimonials
‍
Client Success Stories
Pricing
Bundle pricing
‍
Announcements
‍
FAQ
© 2024 Sundial Capital Research Inc. All rights reserved.
Setsail Marketing
TermsPrivacyAffiliate Program
Risk Disclosure: Futures and forex trading contains substantial risk and is not for every investor. An investor could potentially lose all or more than the initial investment. Risk capital is money that can be lost without jeopardizing ones’ financial security or life style. Only risk capital should be used for trading and only those with sufficient risk capital should consider trading. Past performance is not necessarily indicative of future results.

Hypothetical Performance Disclosure: Hypothetical performance results have many inherent limitations, some of which are described below. No representation is being made that any account will or is likely to achieve profits or losses similar to those shown; in fact, there are frequently sharp differences between hypothetical performance results and the actual results subsequently achieved by any particular trading program. One of the limitations of hypothetical performance results is that they are generally prepared with the benefit of hindsight. In addition, hypothetical trading does not involve financial risk, and no hypothetical trading record can completely account for the impact of financial risk of actual trading. for example, the ability to withstand losses or to adhere to a particular trading program in spite of trading losses are material points which can also adversely affect actual trading results. There are numerous other factors related to the markets in general or to the implementation of any specific trading program which cannot be fully accounted for in the preparation of hypothetical performance results and all which can adversely affect trading results.

Testimonial Disclosure: Testimonials appearing on this website may not be representative of other clients or customers and is not a guarantee of future performance or success.