
Strategy Development with the STEM.MR model
The STEM.MR model (Short-Term Extreme Model - Mean Reversion) is one of our short-term models.
From the description of the model:
It was developed because several of the shorter-term sentiment indicators we follow have displayed a mean-reverting tendency in the past. Meaning, when they go "too far" in one direction, they tend to snap back to their average value. Often when they snap back, it correlates with short-term market turning points.Depending on market conditions, a signal could last anywhere from an hour to several days. Typically, however, the market makes a decision one way or the other and it is usually clear fairly soon whether the signal will be effective or not.
Signals from this model (much like all the other models) are provided by readings below or above extreme readings. For the STEM.MR model, signals are given when the following conditions are met:
If the model exceeds the green (lower) band, then we can safely say that short-term sentiment has reached a pessimistic extreme and we should begin to look for upside reversals at any time.If the model exceeds the upper (red) band, then the optimists may have gotten ahead of themselves and the market may be due for a breather.
For reference, the STEM.MR model is provided in Figure 1 below.
[caption id="attachment_785" align="aligncenter" width="600"]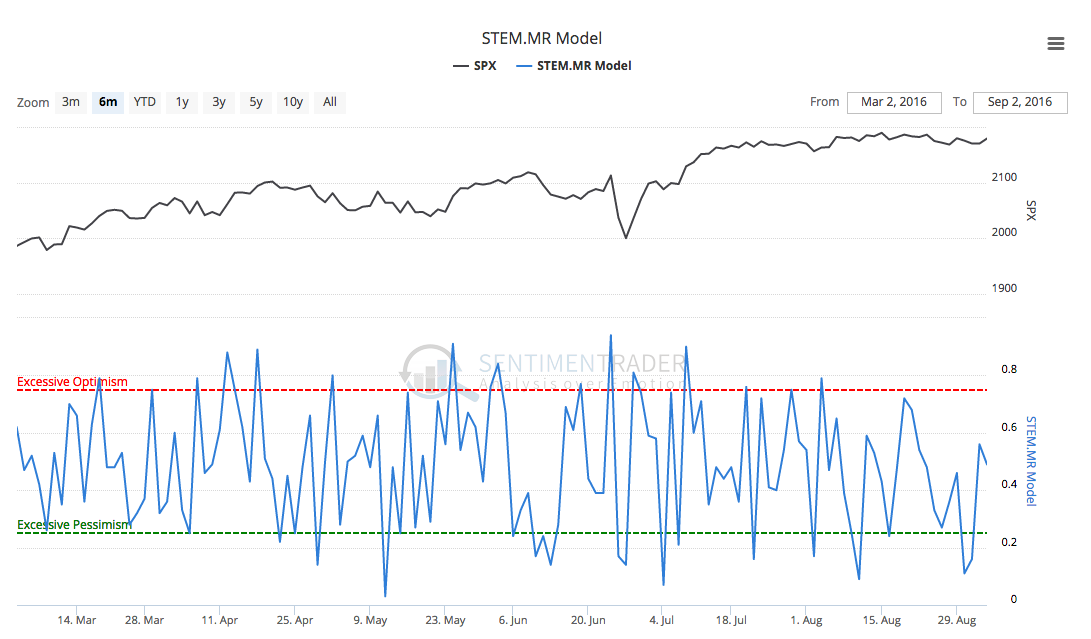 Figure 1: STEM.MR Model[/caption]
Before starting strategy development, I like to look at threshold returns for a signal. The threshold returns for the STEM.MR model is provided in Table 1 below.
[caption id="attachment_786" align="aligncenter" width="551"]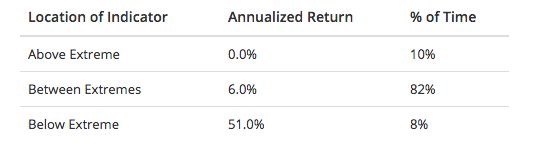 Table 1: Threshold returns for STEM.MR Model[/caption]
These returns show us that on an annualized basis, the returns are very good when the STEM.MR model is below the pessimistic extreme value (0.25 in the case of STEM.MR).
Building a Strategy
Turning to Tradestation, I built a very simple Long only strategy using the following rules:
- Long only
- No Margin. Starting Account size is $250K.
- 1,000 shares of SPY ETF
- Commission of 0.01% per trade
- $0.01 per share slippage
- Go long when:
- STEM.MR is less than or equal to 0.25 (Pessimistic Extreme)
- Close Longs when:
- STEM.MR is greater than or equal to 0.75 (Optimistic Extreme)
- All orders are entered at the open of the next day’s trading session after a signal is given.
- There are no stops used. Positions are held until a close signal is given.
Turning to Tradestation, I built a strategy matching these parameters covering Jan 1 2003 to Sept 2 2016. During this time frame, there were 141 total trades with a 65.96% win rate and a total profit of $100,710 on a $250,000 account. This is a 37.3% Return on Initial Capital and a 2.35% annual rate of return. During this time, the strategy was in the market just over 11 days per trade on average and was in the market about 37.5% of the time.
You can see the Equity Curve in Figure 2 below. Click here to download the TradeStation performance summary for the SPY ETF strategy.
[caption id="attachment_787" align="aligncenter" width="600"]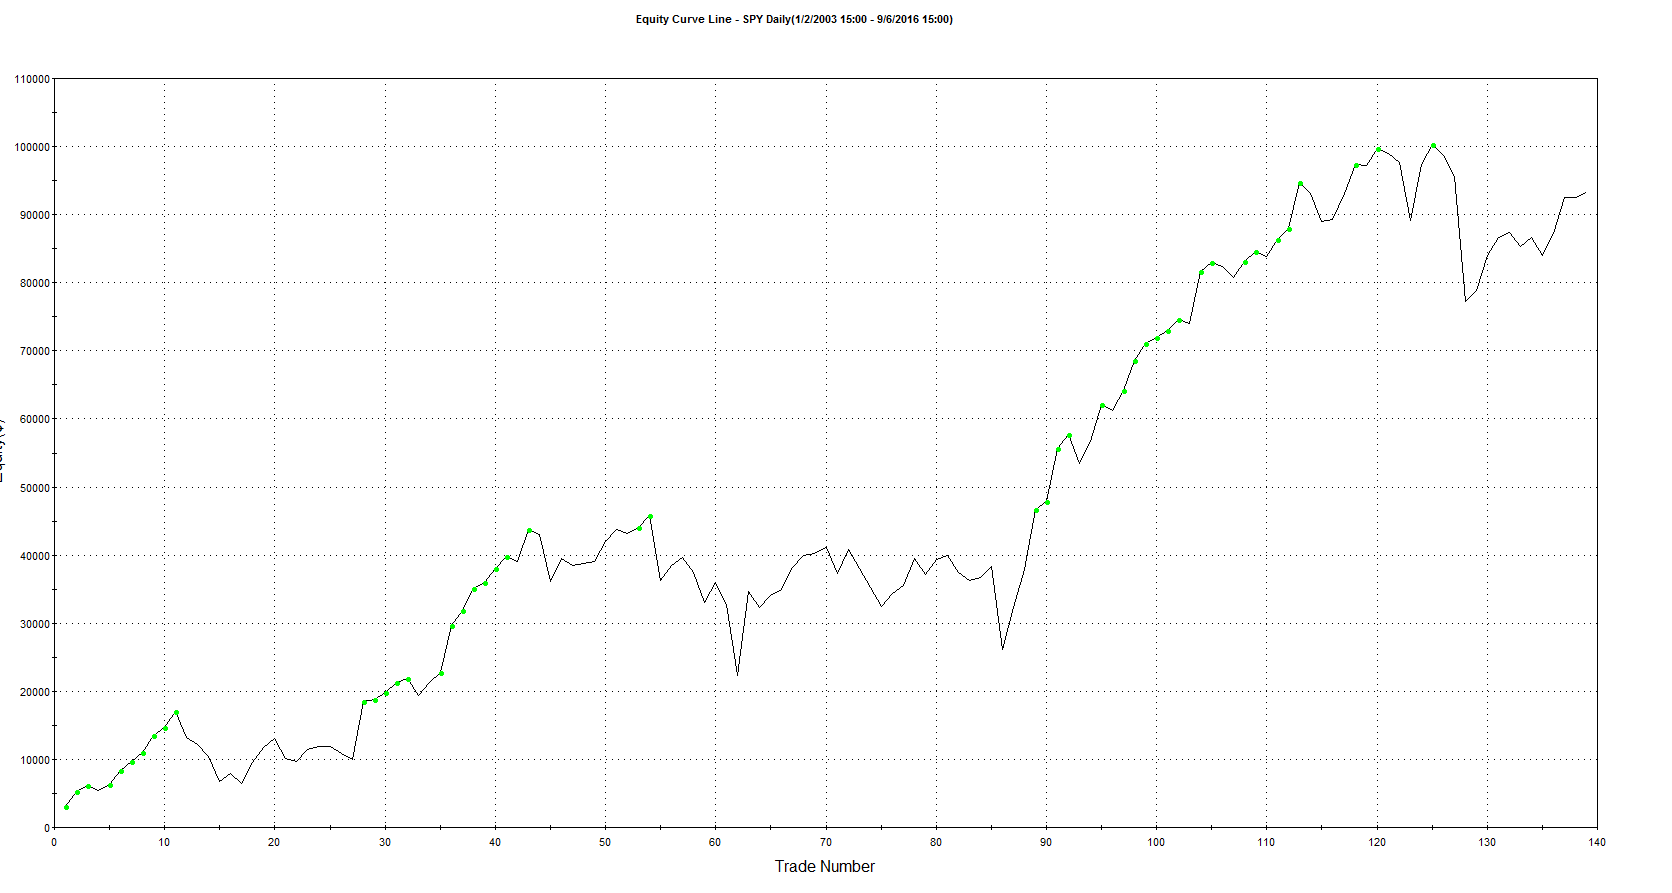 Figure 2: STEM.MR Equity Curve for SPY (no margin)[/caption]
If you take a look at the Tradestation performance summary, you'll see the sharpe ratio is near zero at 0.04. This is far from ideal of course but looking at the drawdowns, there aren't a lot of heavy swings into underwater territory. Max drawdown on this strategy is about $24K, which is less than 10% of initial capital and an average drawdown of about $3,700. That said, looking at the equity curve, there's definitely some room for improvement so more sophisticated entry / exit rules might be in order.
Adding leverage to this strategy sees the returns improve dramatically (as expected with leverage).
Using Tradestation's 'Account Size Required' information, this strategy could be traded with $25,000 and margin for a return on margined account for 396.68% using the SPY ETF.
Applying the same strategy with the S&P 500 E-mini futures trading 10 contracts, $1.25/contract commission and $18.50 slippage per trade, this strategy delivers an annual rate of return of 7.33% and 168.45% Return on Initial Capital. This leverage also brings much more drawdown with a max drawdown of about 62% of total Initial Capital at the time of drawdown.