
Strategy Development with the SPY Optimism Index (Optix)
On June 24, 2016, the SPY Optimism Index (Optix) indicator closed at 10, which is the lowest reading since Feb 11, 2016. For the SPY Optix, any reading below 20 is considered to be in ‘Excessive Pessimism’ territory.
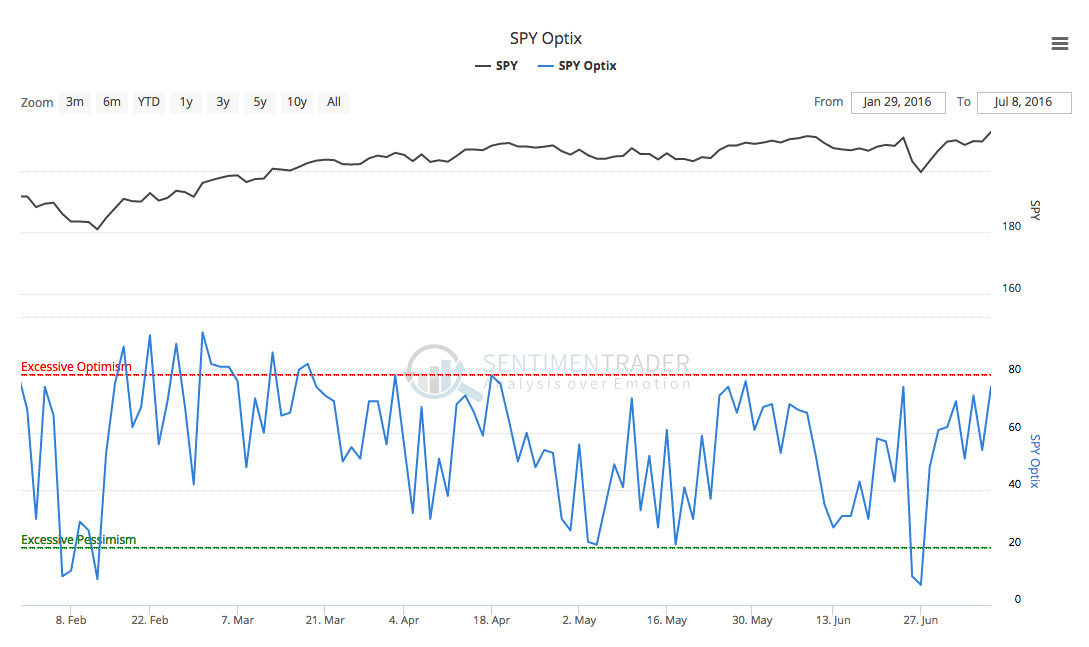
Since both Feb 11th and June 24th SPY Optix readings seem to offer very good signals for higher prices, I wanted to take a look at building a tradeable system using the SPY Optix signal.
As a refresher, the Optimism Index for ETF’s is based on the following data:
- Trading activity in put options versus call options
- Future volatility expectations
- Average discount of the fund to its NAV
- Price behavior
Each measure is ranked against its historical norms to determine whether or not the current level is at an extreme, then totaled to come up with an overall score. The Optix can go from 0 (maximum pessimism) to 100 (maximum optimism), though it generally stays above 20 and below 80. You can find more on the SPY Optix here.
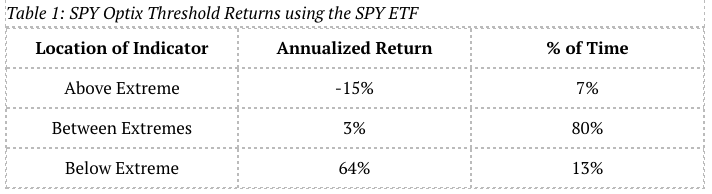
Before diving into strategy development, I always like to look at threshold returns for a signal to check if there might be enough evidence of a quality signal. When I calculate threshold returns, I am looking for the annualized returns for a signal when that signal is in the desired state. For example, for SPY Optix with Excessive Optimism at 80 and Excessive Pessimism at 20, I want to know annualized returns when the Optix is above 80 or below 20. In addition to the annualized returns, I like to look at the percentage of time the signal spends in each threshold.
The threshold returns for the SPY Optix indicator covering June 20 2005 to July 8 2016 are provided in the table 1. From the table, we can SPY Optix gives a 64% annualized return (using the SPY ETF as the underlying) over the period, which is a pretty good sign that there’s some type of signal here.
Building a Strategy with the SPY Optix
I like to keep things simple when building strategies and I don’t like to optimize parameters or use leverage until I know that a decent signal exists and a strategy can be profitable. For the SPY Optix, I wanted to take the simplest approach possible and take every signal the SPY Optix provides if the SPY ETF is in a bull market.
The strategy parameters are:
- Long only
- No Margin. Account size is $250K.
- 1,000 shares of SPY ETF
- Commission of $10 per trade
- $0.01 per share slippage
- Go long when:
- SPY is above or equal to the 200 day simple moving average
- SPY Optix closes below 20 (Excessive Pessimism)
- Close when:
- SPY Optix closes above 80 (Excessive Optimism)
- All orders are entered at the open of the next day’s trading session after a signal is given.
- There are no stops used. Positions are held until a close signal is given.
Using TradeStation 9.5, I built a simple strategy trading matching these parameters. From Jan 1 2006 to July 8 2016, there were 33 total trades with a 72.73% win rate with a total profit of $58,570 on a $250,000 account (23.43% Return on Initial Capital) for a 2.16% annual rate of return. During this time, the strategy was in the market just over 40 days per trade on average and was in the market about 38% of the time.
You can see the Equity Curve in Figure 1 below. Click here to download theTradeStation performance summary for the SPY ETF strategy.
[caption id="attachment_654" align="aligncenter" width="501"]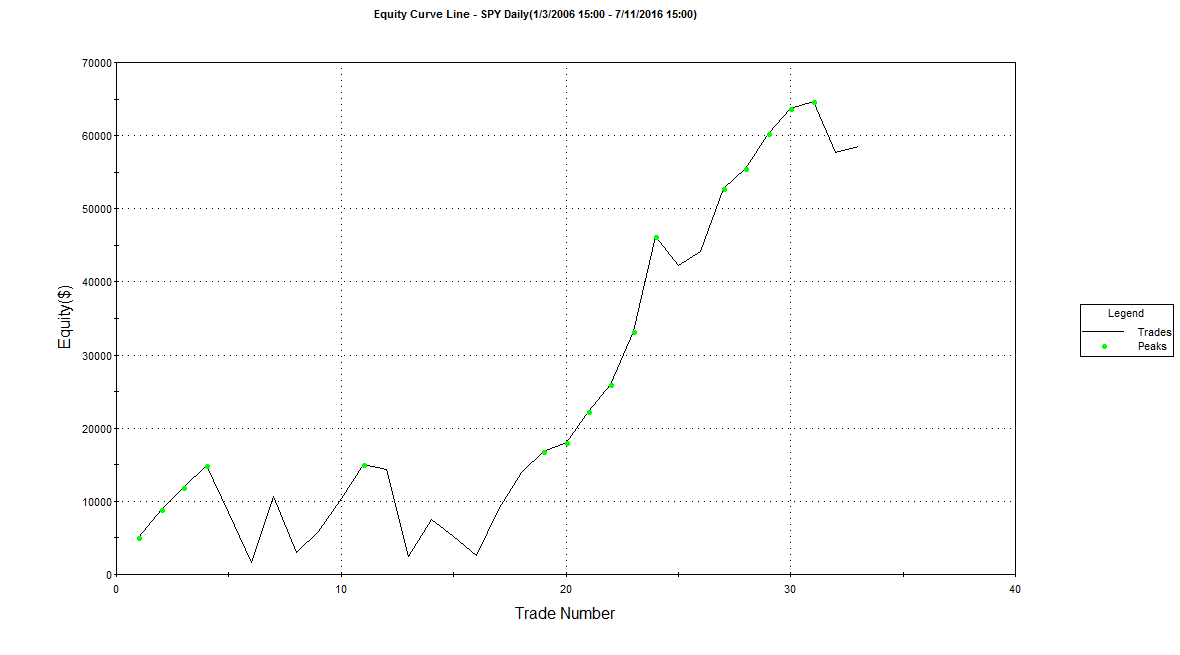 Figure 1: SPY Optix Equity Curve for SPY ETF[/caption]
Taking this same strategy and applying leverage by using the S&P 500 E-Mini futures contract (using the continuous contract @ES with TradeStation), we see a pretty good increase in the returns from this strategy.
During the same timeframe (Jan 1 2006 to July 8 2016) trading 10 contracts of the E-Mini, $1.25 per share commission and slippage of $18.50 per trade, we see a total profit of $369,829 using a $250,000 account (147.93% Return on Initial Capital) for a 9.33% annual rate of return.
You can see the Equity Curve in Figure 2 below. Click here to download the TradeStation performance summary for the S&P 500 E-Mini futures contract strategy.
[caption id="attachment_658" align="aligncenter" width="500"]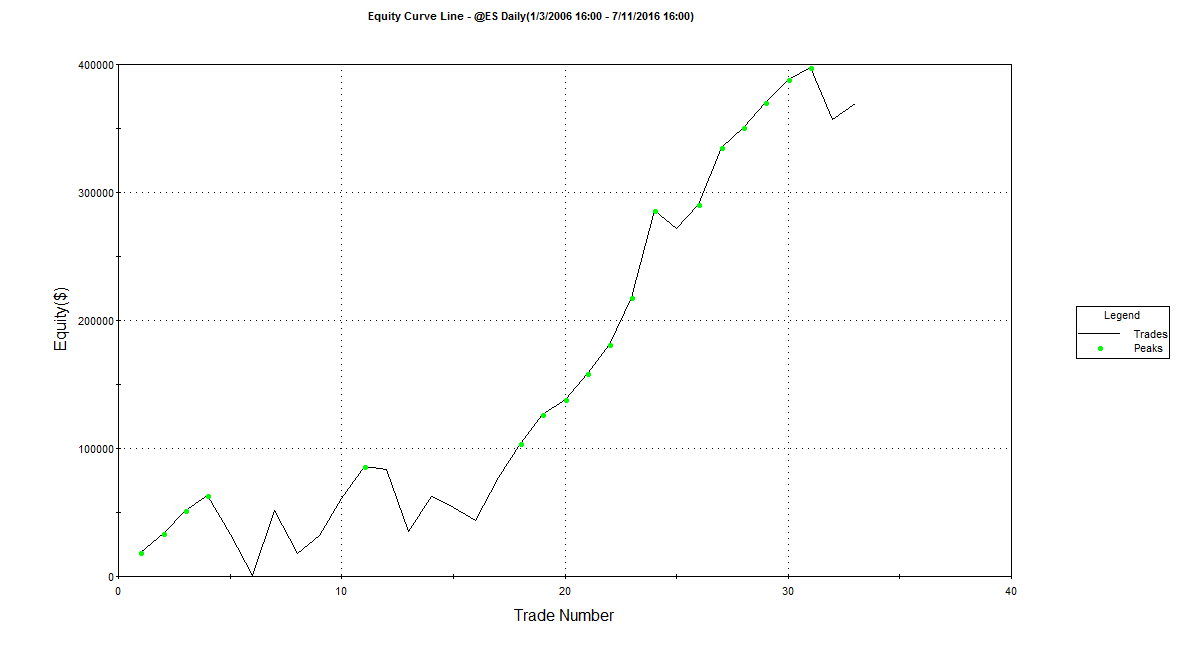 Figure 2: SPY Optix Equity Curve for @ES[/caption]
Both strategies look pretty good, especially given their simplicity but there are some pretty hefty drawdowns for each. The non-leveraged strategy saw an average drawdown of about $6K and a max drawdown of about $24K (~8% of account value at the time of the drawdown). The leveraged strategy had an average drawdown of about $30K with a max drawdown of about $124K (~20% of account value at the time of this drawdown).
It is worth pointing out that both strategies are currently long. They both entered long at the open on June 27th, the first trading day after the signal on June 24th.
You can view the TradeStation performance summaries for more detailed trade statistics.
- TradeStation performance summary for the SPY ETF strategy
- TradeStation performance summary for the S&P 500 E-Mini futures contract strategy
While simple, the strategy highlighted here provides evidence that the SPY Optix indicator provides a good timing signal for long entries into the market (as long as the market is above the 200 day moving average).
Stay tuned as I continue to look at how to implement strategies using the SPY Optix and other indicators.