
Strategy Development with Short Term Risk Levels
Yesterday I wrote about the new Market Outlook feature on the user dashboard as well as the new risk level charts that are used to build the daily outlook. Today, I wanted to share a trading strategy that I built using one of the new risk level indicators.
The strategy is very similar to the SPY Optix strategy I previously wrote about. This new strategy uses the Short-Term Risk Level indicator and shows some promise in this indicator as as trading signal.
As a refresher, the Short-Term Risk Level indicator is (taken from the description of the indicator):
...quick way to gauge what our indicators and studies are suggesting. The higher the risk, the more likely the market is to decline. Another way to look at it is in terms of cash. If the Correction Risk Level is 0, then we would be more inclined to keep 0% of our portfolio in cash (i.e. we would be fully invested). But if the Correction Risk Level is 10, then we would be more inclined to keep 100% of our portfolio in cash (i.e. no exposure to stocks).
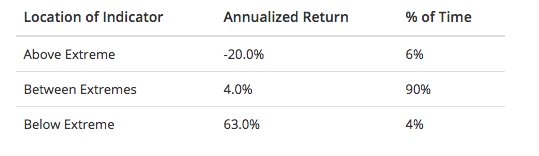
Before diving into building a strategy with this indicator, I always like to look at threshold returns to get a gauge of what type of returns are possible from a signal. Figure 1 show the annualized threshold returns for the Short-Term Risk Level from Jan 4 2000 to June 25 2016.
[caption id="attachment_690" align="aligncenter" width="539"] Figure 1: Threshold Returns for Short-Term Risk Levels[/caption]
From the threshold returns, we can see that there's definitely a signal to go long when the Short-Term Risk Level signal is below the extreme.
Building a Strategy with Short-Term Risk Levels
As I mentioned in the SPY Optix strategy article, I like to keep things simple when starting out with a new indicator and strategy. I don't like to optimize any parameters or run any fancy entry / exit systems until I can see what a simple approach can deliver.
For this strategy, the following parameters were used:
- Long only
- No Margin. Account size is $250K.
- 1,000 shares of SPY ETF
- Commission of $0.01 per share
- $0.01 per share slippage
- Go long when:
- Short-Term Risk Level closes below 3 (the average value between "Below Avg Risk" and "Low Risk"thresholds)
- Close when:
- Short-Term Risk Level closes above 7 (the average value between "Above Avg Risk" and "High Risk" thresholds)
- All orders are entered at the open of the next day’s trading session after a signal is given.
- There are no stops used. Positions are held until a close signal is given.
Using TradeStation 9.5, I built a simple strategy that matches these parameters. From Jan 4 2000 to July 25 2016, there were 143 total trades with a 72.73% win rate, a total profit of $138,380 on a $250,000 account (55.35% Return on Initial Capital) for a 2.79% annual rate of return. During this time, the strategy was in the market 26.39% of the time and averaged just over 8 days per trade.
You can see the Equity Curve in Figure 1 below. Click here to download theTradeStation performance summary for the SPY ETF strategy.
[caption id="attachment_701" align="aligncenter" width="600"]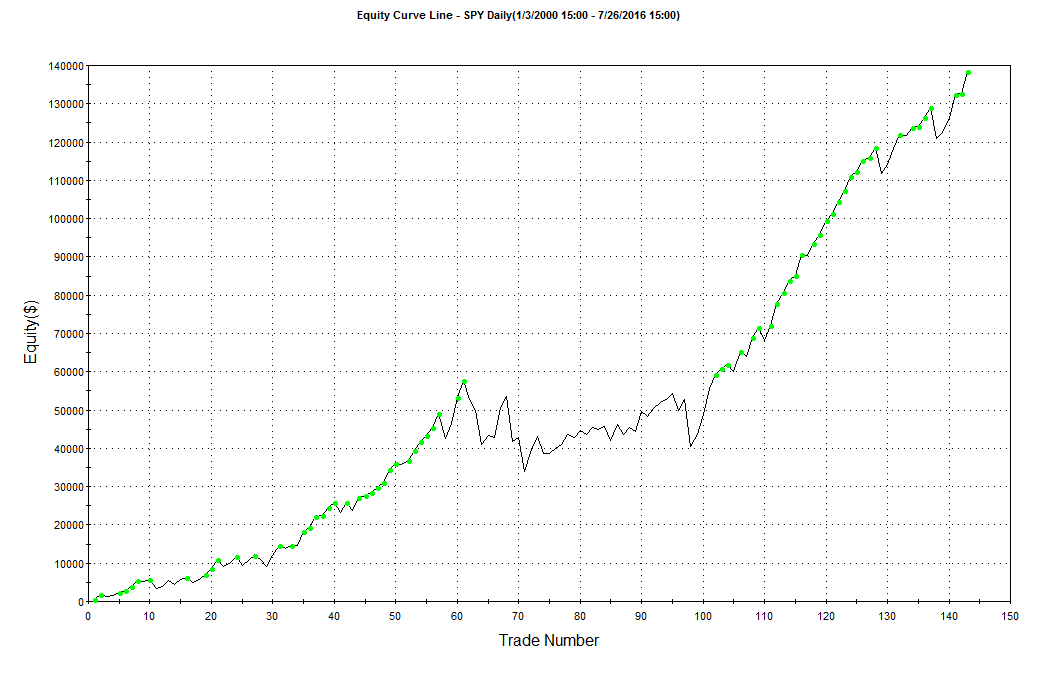 Figure 2: Equity Curve for Short-Term Risk Level SPY Strategy[/caption]
While the 2.79% annual rate of return isn't mind-blowing, the equity curve shows that there is real promise.
Using Leverage (with S&P 500 E-Mini Futures)
Taking this same strategy and applying leverage by using the S&P 500 E-Mini futures contract (using the continuous contract @ES with TradeStation), we see a pretty good increase in the returns from this strategy.
During the same timeframe (Jan 4 2000 to July 25 2016) trading 10 contracts of the E-Mini, $1.25 per share commission and slippage of $18.50 per trade, we see a total profit of $712,884 using a $250,000 account (285.15% Return on Initial Capital) for a 8.55% annual rate of return.
You can see the Equity Curve in Figure 3 below. Click here to download the TradeStation performance summary for the S&P 500 E-Mini futures contract strategy.
[caption id="attachment_700" align="aligncenter" width="600"]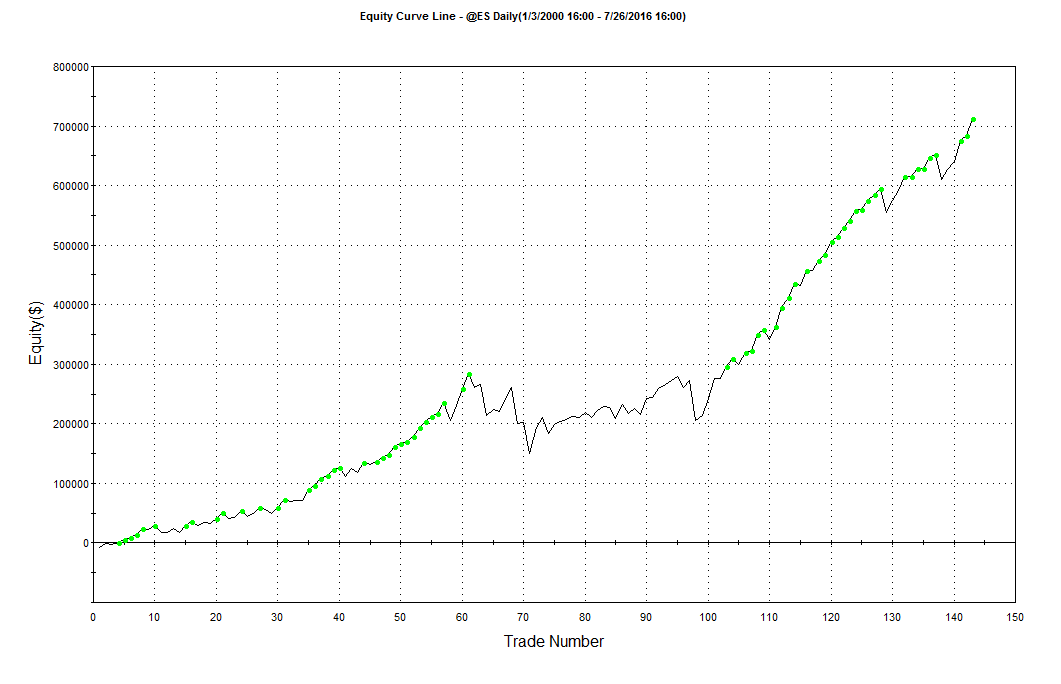 Figure 3: Equity Curve for Short-Term Risk Level @ES Strategy[/caption]
Drawdown of both strategies
Both strategies deliver good results prior to any optimization or parameter changes, especially given their simplicity but there is some volatility and drawdowns for each.
The non-leveraged SPY strategy saw an average drawdown of about $3500 and a max drawdown of about $30K, which is about 12% of initial capital and about 11% of the account value at the time of the drawdown.
The leveraged strategy had an average drawdown of about $18.5K with a max drawdown of about $140K, which is about 50% of initial capital value and about 35% of the account value at the time of this drawdown.
For both strategies, the worst volatility and drawdowns occurred during 2008.
Removing Volatility / Drawdowns
I wanted to see what this indicator would do with some type of trend filtering so I built another strategy using a 50-day moving average as a filter for trend. Both strategies deliver much better on the drawdown and volatility fronts. I won't go into details about the strategies here but have provided a summary below.
Short-Term Risk Level with SPY - 50-day Moving Average
- 72 trades, 73.61% win rate
- 27.73% return on initial capital, 1.55% annualized return
- $2500 average drawdown and about $17K max drawdown
Short-Term Risk Level with @ES - 50-day Moving Average
- 72 trades, 73.61% win rate
- 157.41% return on initial capital, 6.00% annualized return
- $14K average drawdown and about $85K max drawdown
Conclusion
While neither strategy is something that I'd throw money at as-is due to the volatility / drawdown issues, there is some promise in this indicator as a signal for long entries.
You can view the TradeStation performance summaries for more detailed trade statistics.
Original Strategy files:
- TradeStation performance summary for the SPY ETF strategy - No Trend filter
- TradeStation performance summary for the S&P 500 E-Mini futures contract strategy - No trend filter
50-day Moving Average strategy files: