
Strategy Development: SPY Optix with Medium-Term Risk Levels
Next up in the strategy development series, I decided to combine two of our indicators into a strategy.
In this strategy, I'm using the SPY Optix as the entry 'signal' and the Medium-Term Risk Levels indicator as the exit 'signal.'
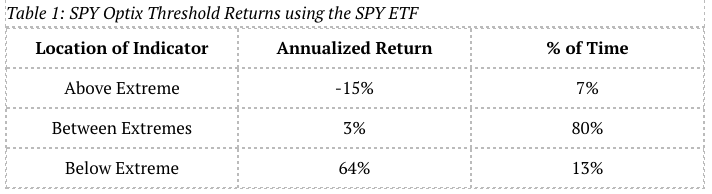
In the previous SPY Optix strategy, I shared the threshold returns for this indicator when it is above/below and between the extreme thresholds. I'll share it again here in Figure 1 for reference.
[caption id="attachment_667" align="aligncenter" width="600"] Figure 1: SPY Optix Threshold Returns[/caption]
Building a Strategy
Using the SPY Optix indicator as the entry signal (the indicator must close at or below 20) and the Medium-Term Risk Level indicator as the exit (the indicator must close at or above 7), I developed the strategy outlined below using both SPY and the S&P 500 E-mini.
The strategy for the SPY trade are:
- Long only
- No Margin. Account size is $250K.
- 1,000 shares of SPY ETF
- Commission of $10 per trade
- $0.01 per share slippage
- Go long when:
- SPY is above or equal to the 200 day simple moving average
- SPY Optix closes below 20 (Excessive Pessimism)
- Close when:
- Medium-Term Risk Level closes above 7 (Above Average Risk)
- All orders are entered at the open of the next day’s trading session after a signal is given.
- There are no stops used. Positions are held until a close signal is given.
Using TradeStation, I built a strategy trading matching these parameters. From Jan 1 2006 to August 4 2016, there were 30 total trades with a 93.33% win rate, a total profit of $124,920 on a $250,000 account. This is a 49.97% Return on Initial Capital and a 2.57% annual rate of return. During this time, the strategy was in the market just over 78 days per trade on average and was in the market about 40% of the time.
You can see the Equity Curve in Figure 2 below. Click here to download theTradeStation performance summary for the SPY ETF strategy.
[caption id="attachment_720" align="aligncenter" width="600"]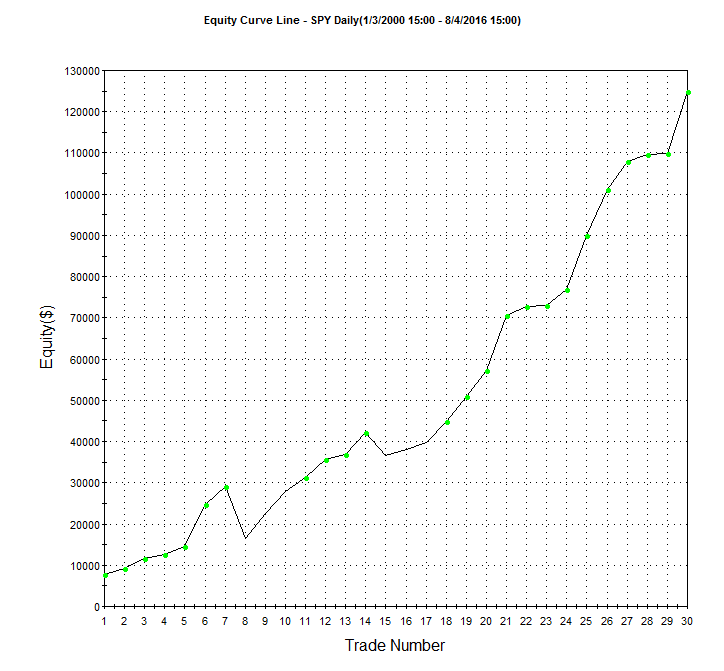 Figure 2: SPY Optix with Medium-Term Risk Level Exit with SPY[/caption]
Taking this same strategy and applying leverage by using the S&P 500 E-Mini futures contract (using the continuous contract @ES with TradeStation), we see a pretty good increase in the returns from this strategy.
During the same timeframe (Jan 1 2006 to August 4 2016) trading 10 contracts of the E-Mini, $1.25 per share commission and slippage of $18.50 per trade, we see a total profit of $690,890 using a $250,000 account. This is a 276.36% Return on Initial Capital and a 8.39% annual rate of return.
You can see the Equity Curve in Figure 3 below. Click here to download the TradeStation performance summary for the S&P 500 E-Mini futures contract strategy.
[caption id="attachment_723" align="aligncenter" width="600"]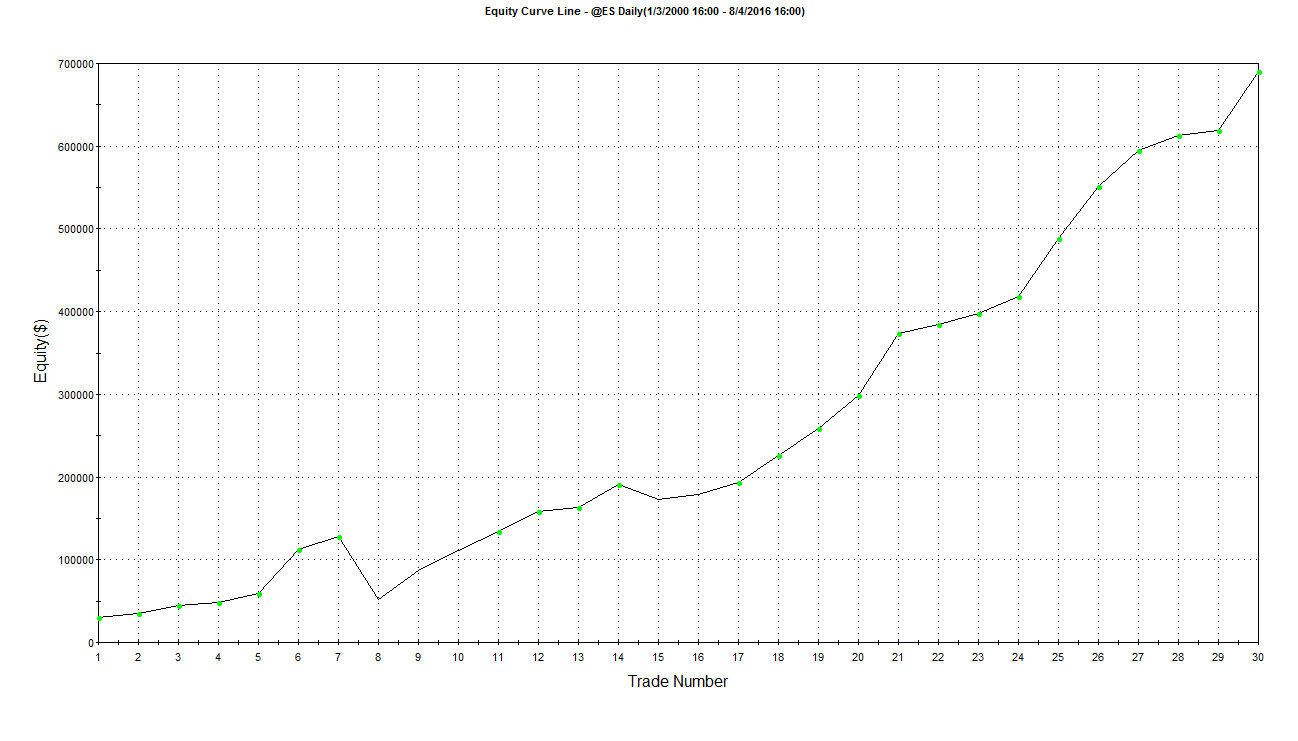 Figure 3: SPY Optix with Medium-Term Risk Level Exit with @ES[/caption]
Drawdown and Volatility
Both strategies deliver good results without any optimization or parameter changes but but there is some volatility and drawdowns found within each.
The non-leveraged SPY strategy saw an average drawdown of about $7600 and a max drawdown of about $29K, which is about 12% of initial capital and about 11% of the account value at the time of the drawdown.
The leveraged strategy had an average drawdown of about $37K with a max drawdown of about $155K, which is about 62% of initial capital value and about 41% of the account value at the time of the drawdown.
For a quick test, I added a default exit strategy included with Tradestation called "Channel Trailing LX" and used the default values (Length=3, FloorAmt=1, PositionBasis=False) to see what the strategy might look like with stops added. This particular stop strategy removed a good portion of the drawdown from the E-mini strategy (max drawdown was reduced from $155K to $23K and returns reduced to 5.77% annual rate of return.
Conclusion
While the returns look very good on this strategy, the drawdowns could be hard to handle without adding some risk management to manage the volatility. That said, each person likes different risk management approaches, so I tend to stay away from building strategies with stops implemented until I see whether there's value there. I think there's some value to be found in the SPY Optix itself as well as combining it with other signals to produce more advanced strategies.
You can view the TradeStation performance summaries for more detailed trade statistics.