
Strategy Development - Smart Money / Dumb Money Confidence Spread
In this post, I continue my look at various models / indicators for strategy development by using the Smart Money / Dumb Money Confidence Spread to build a Long and Short strategy. The latest chart of the Spread is shown in Figure 1.
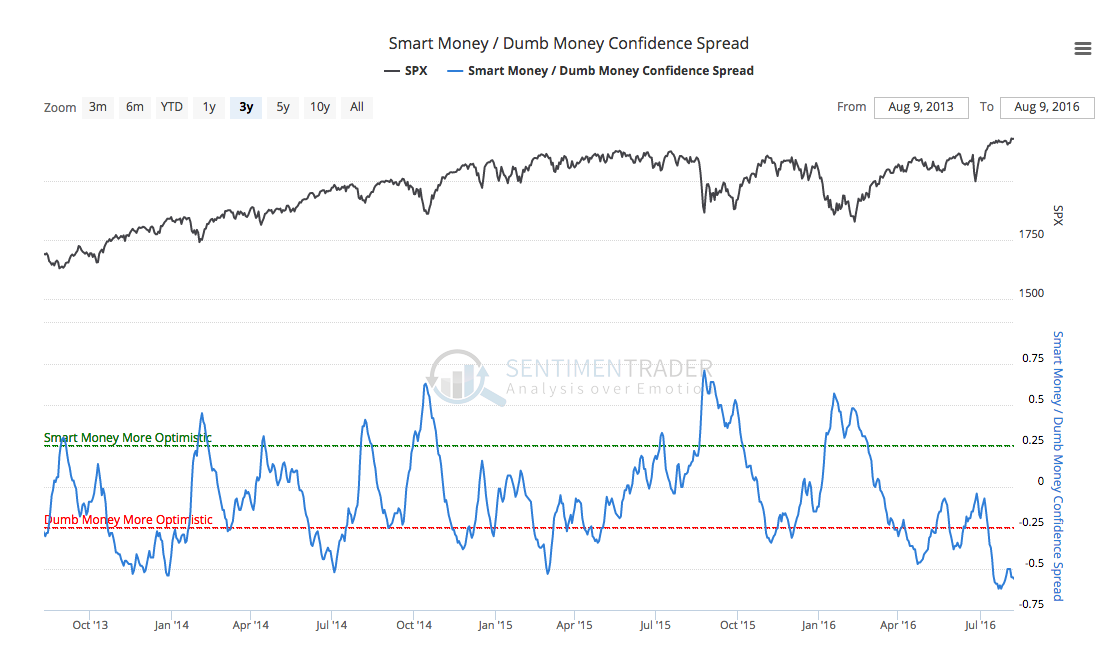 Figure 1: Smart Money / Dumb Money Confidence Spread
As a reminder of what the Smart Money / Dumb Money Spread is, here's the definition from the description:
The Smart Money Confidence and Dumb Money Confidence indices are a unique innovation that allows subscribers to see, in one quick glance, what the 'good' market timers are doing with their money compared to what 'bad' market timers are doing.
Our Confidence indices use mostly real-money gauges - there are few opinions involved here.
The Confidence Spread subtracts the Dumb Money from the Smart Money. So when the Spread is very high (above 0.25), that means the Smart Money is looking for a rally, and the Dumb Money is looking for a decline; we should expect stocks to rise after those conditions.
When the Spread is very low (below -0.25) then the Smart Money is anticipating a decline and the Dumb Money a rally; we should expect stocks to decline after that.
Building a Strategy with the Smart Money / Dumb Money Confidence Spread
Threshold returns for the Spread are shown in Figure 2. based on these returns, there appears to be somewhat of a signal to be found when Smart Money is more optimistic.
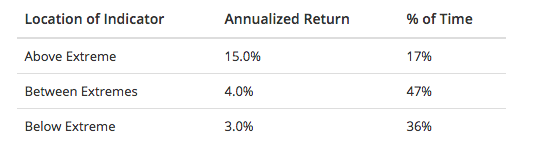 Figure 2: Threshold Returns for Smart Dumb Spread[/caption]
Additionally, a quick glance at the chart backs up that thesis but it also shows that Dumb Money being more optimistic tends to highlight moves lower in the market.
Using the Smart Dumb Spread, I built a strategy that takes both Long and Short trades. The rules for the strategy are
- Long and Short only
- No Margin. Starting Account size is $250K.
- 1,000 shares of SPY ETF
- Commission of 0.01% per trade
- $0.01 per share slippage
- Go long when:
- SPY is above or equal to the 200 day simple moving average
- Smart Dumb Spread is greater than 0.25 ( Smart Money is More Optimistic)
-
Close Longs when:
-
Smart Dumb Spread is less than -0.25 ( Dumb Money is More Optimistic)
-
Go Short when:
- SPY is less than or equal to the 200 day simple moving average
-
Smart Dumb Spread is less than -0.25 ( Dumb Money is More Optimistic)
-
CloseShort when:
-
Smart Dumb Spread is greater than 0.25 ( Smart Money is More Optimistic)
-
-
All orders are entered at the open of the next day’s trading session after a signal is given. There are no stops used. Positions are held until a close signal is given.
Using TradeStation, I built a strategy trading matching these parameters. From Feb 2 1993 to August 10 2016, there were 29 total trades with a 82.76% win rate, a total profit of $165,780 on a $250,000 account. This is a 66.31% Return on Initial Capital and a 2.24% annual rate of return. During this time, the strategy was in the market just over 100 days per trade on average and was in the market about 35% of the time.
You can see the Equity Curve in Figure 3 below. Click here to download the TradeStation performance summary for the SPY ETF strategy.
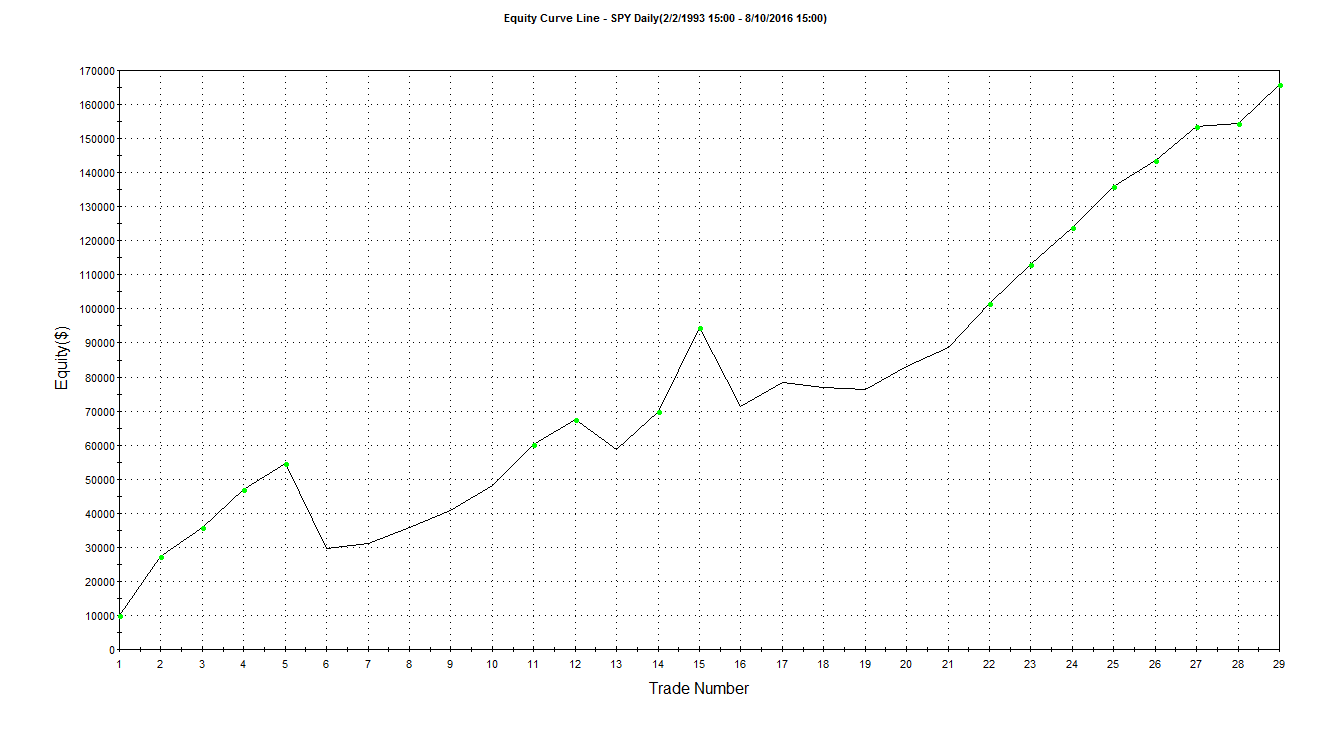 Figure 3: Smart Dumb Spread Equity Curve
For this strategy, the average drawdown was $8,056 with a max drawdown of $31,650 (about 9% of the account value at the time of drawdown). The Sharpe Ratio of this strategy is a low 0.16, which highlights the volatility found with this strategy. With more sophisticated entry / exit rules, the volatility might be decreased (or at least better managed).Using leverage brings greater returns with this strategy. Applying the same logic with the S&P 500 E-mini futures, an annual rate of return of 8.2% is delivered with 341.63% Return on Initial Capital. This leverage also brings more drawdown with a max drawdown of about 25% of total account value at the time of drawdown.
Note: I also looked at just a Long Only strategy for the Smart Dumb Spread over the same time period. It performed worse than this Long / Short strategy returning an annual rate of return of ~1.75%.
You can view the TradeStation performance summaries for more detailed trade statistics.