Data &
Technology
Research
Reports
Report Solutions
Reports Library
Actionable
Strategies
Free
Resources
Simple Backtest Calculator
Simple Seasonality Calculator
The Kelly Criterion Calculator
Sentiment Geo Map
Public Research Reports
Free Webinar
Pricing
Company
About
Meet Our Team
In the News
Testimonials
Client Success Stories
Contact
Log inLoginSign up
< BACK TO ALL REPORTS

Stopping at a line in the sand

Jason Goepfert
2021-02-03
More than 40% of stocks in the S&P 500 have held above their 50-day moving averages, an important threshold.

Last week, there was a quick and substantial pullback in the percentage of stocks within the S&P that were above their own 50-day moving averages. That corrected further on Friday and stopped right around the 40% level. In healthy market environments, this is about where it tends to stop as buyers tend to step in quickly and that's about it for the pullbacks. It appears the same thing happened this time, though it's still too early to tell.

The percentage of industries and sectors above their 50-day averages both plunged below 40%, so that bears watching. More than 40% of countries are still above their average, so that's a bit of a positive. 

Percentage of sectors and industries above 50 day moving average

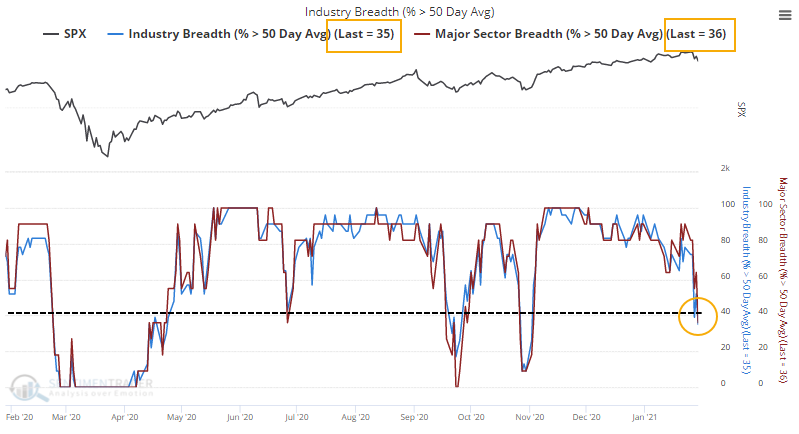
Among sectors, it's mostly the defensive ones that are seeing the fewest stocks above their 50-day averages, so there is still evidence of a risk-on mentality.

What else we're looking at

  • What happens when the S&P 500 suffers a Key Reversal Week
  • Forward returns following a break of the medium-term trend
  • Silver jumped more than 10% in a single day, and history shows a clear pattern afterward
  • Stocks have enjoyed back-to-back unfilled gaps following a selloff
  • What happens after fear subsides like it has the past couple of days
  • Wheat futures have a very interesting history at this time of year
  • The percentage of S&P 500 beating the index on shorter time frames is holding up

Stat Box

On Tuesday, there were 0 securities that fell to a 52-week low at any point during the day on the NYSE exchange. This is only the 6th time in the past 35 years this has happened, according to our records.


Sentiment from other perspectives

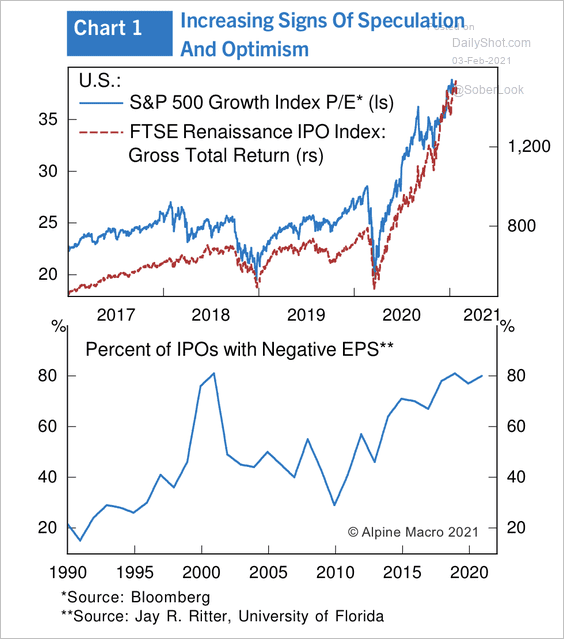
New companies are losing money, and their share prices are soaring. This is nothing new - it's been a theme for months, if not longer. But recent IPOs are overwhelming coming to money without a proven business model, or at least one where, you know, making a profit means something. Source: Alpine Macro via Daily Shot

money losing ipos and performance

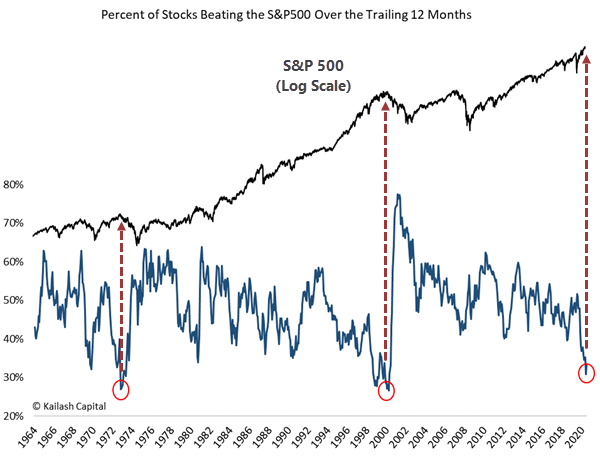
The average stock can't beat the index. Pity the poor fund manager trying to outpace the S&P 500 as the percentage of stocks beating the index over the past 12 months plunges toward record lows. We superimposed a price chart of the S&P along with arrows showing the last two similar extremes. Source: Kailash Concepts

percentage of stocks beating the S&P 500

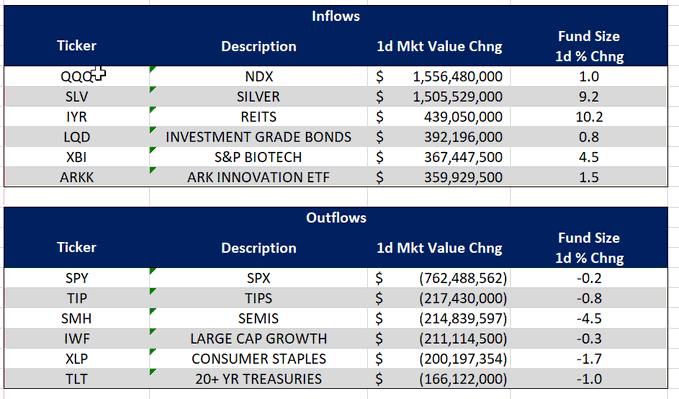
All aboard the tech train, again. Flows to start the week heavily favored tech and "innovative" companies, while shunning things that people consume. Source: Christian Fromhertz

1 day fund flow

DATA &
TECHnologies
IndicatorEdge
‍
BackTestEdge
‍
Other Tools
‍
DataEdge API
RESEARCH
reports
Research Solution
‍
Reports Library
‍
actionable
Strategies
Trading Strategies
‍
Smart Stock Scanner
‍
FREE
RESOUrCES
Simple Backtest
Calculator
Simple Seasonality
Calculator
The Kelly Criterion
Calculator
Sentiment Geo Map
‍
Public Research Reports
‍
Free Webinar
COMPANY
‍
About
‍
Meet our Team
‍
In the News
‍
Testimonials
‍
Client Success Stories
Pricing
Bundle pricing
‍
Announcements
‍
FAQ
© 2024 Sundial Capital Research Inc. All rights reserved.
Setsail Marketing
TermsPrivacyAffiliate Program
Risk Disclosure: Futures and forex trading contains substantial risk and is not for every investor. An investor could potentially lose all or more than the initial investment. Risk capital is money that can be lost without jeopardizing ones’ financial security or life style. Only risk capital should be used for trading and only those with sufficient risk capital should consider trading. Past performance is not necessarily indicative of future results.

Hypothetical Performance Disclosure: Hypothetical performance results have many inherent limitations, some of which are described below. No representation is being made that any account will or is likely to achieve profits or losses similar to those shown; in fact, there are frequently sharp differences between hypothetical performance results and the actual results subsequently achieved by any particular trading program. One of the limitations of hypothetical performance results is that they are generally prepared with the benefit of hindsight. In addition, hypothetical trading does not involve financial risk, and no hypothetical trading record can completely account for the impact of financial risk of actual trading. for example, the ability to withstand losses or to adhere to a particular trading program in spite of trading losses are material points which can also adversely affect actual trading results. There are numerous other factors related to the markets in general or to the implementation of any specific trading program which cannot be fully accounted for in the preparation of hypothetical performance results and all which can adversely affect trading results.

Testimonial Disclosure: Testimonials appearing on this website may not be representative of other clients or customers and is not a guarantee of future performance or success.