Data &
Technology
Research
Reports
Report Solutions
Reports Library
Actionable
Strategies
Free
Resources
Simple Backtest Calculator
Simple Seasonality Calculator
The Kelly Criterion Calculator
Sentiment Geo Map
Public Research Reports
Free Webinar
Pricing
Company
About
Meet Our Team
In the News
Testimonials
Client Success Stories
Contact
Log inLoginSign up
< BACK TO ALL REPORTS

Stocks Up and Yields Down

Dean Christians
2021-06-11
The S&P 500 closed at a new high as the 10-year yield dropped to a 3-month low. Let's assess the forward return outlook for stocks, commodities, and Bonds.

The S&P 500 closed at a new all-time high on Thursday as the 10-year yield simultaneously closed at a 3-month low.

What is the bond market trying to tell us with the move lower in yields in the face of a strong economy and higher than average inflation?

While it's fun to make an educated guess, let's see what history has to say about the forward return outlook for stocks, commodities, and bonds.

The following study identified each instance in history when the S&P 500 closed at a 3-year high and the 10-year bond yield simultaneously closed at a 3-month low. I screened out repeat signals by requiring the 10-year bond yield to register a new 3-month high before an additional signal could trigger.

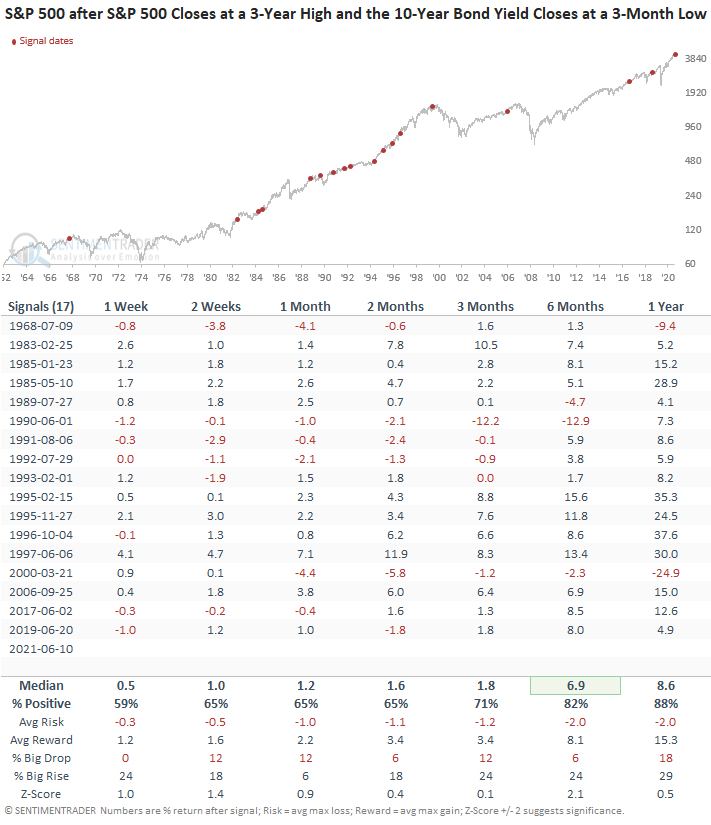
HOW THE SIGNALS PERFORMED - S&P 500

Returns look constructive across the table except for the early 1990s and the March 2000 signal. I would note that most instances triggered between 1989 and 1997, a period where returns for value and growth were almost identical.

The S&P 500 performance table reflects price-only data. All other stock tables are total returns.

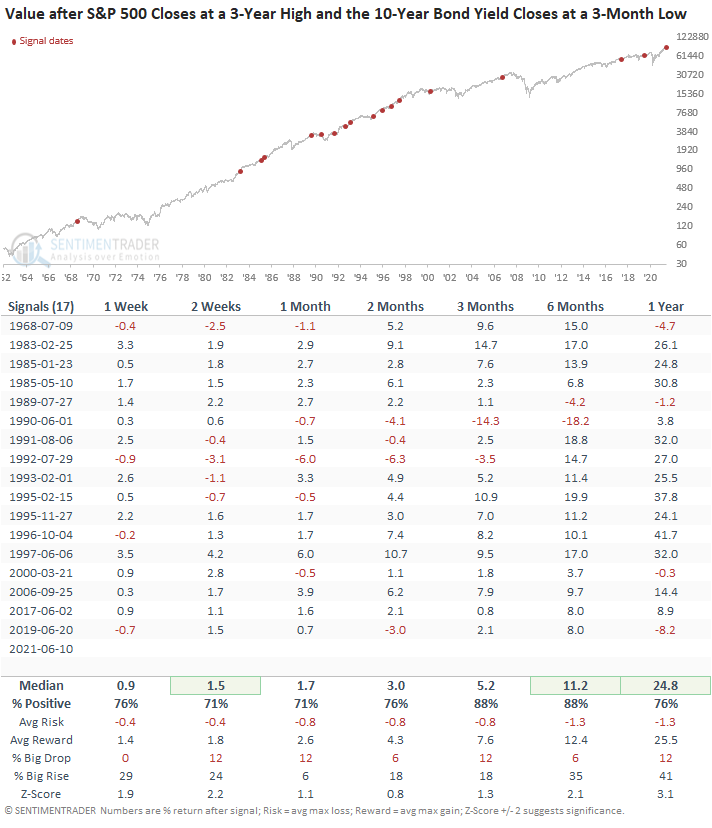
HOW THE SIGNALS PERFORMED -VALUE

Value performed very well with the best median returns of any group, especially in the 6-12 month timeframe.

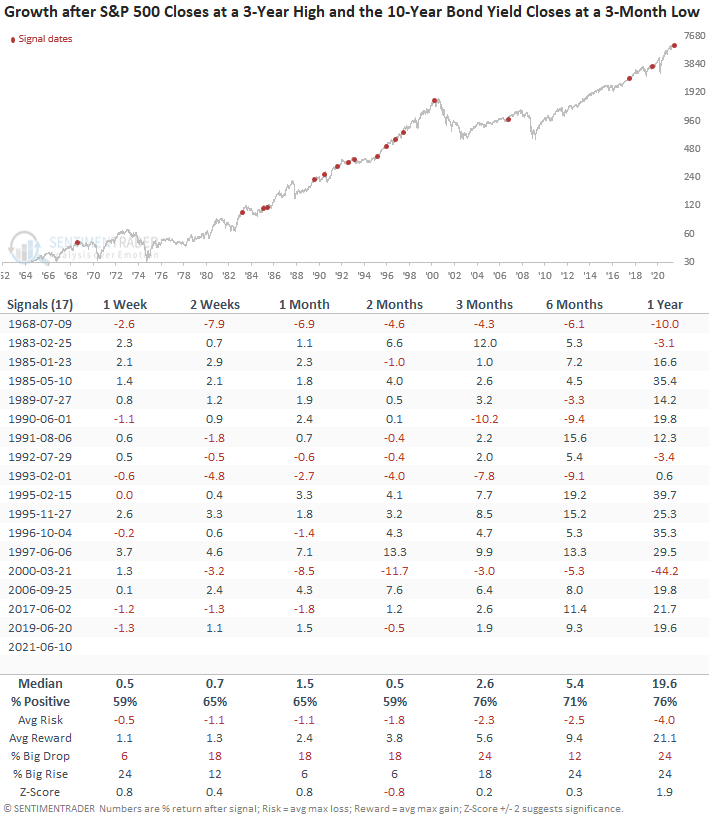
HOW THE SIGNALS PERFORMED -GROWTH

The short to intermediate-term returns were in line with more constructive performance in the 3-12 month timeframe.

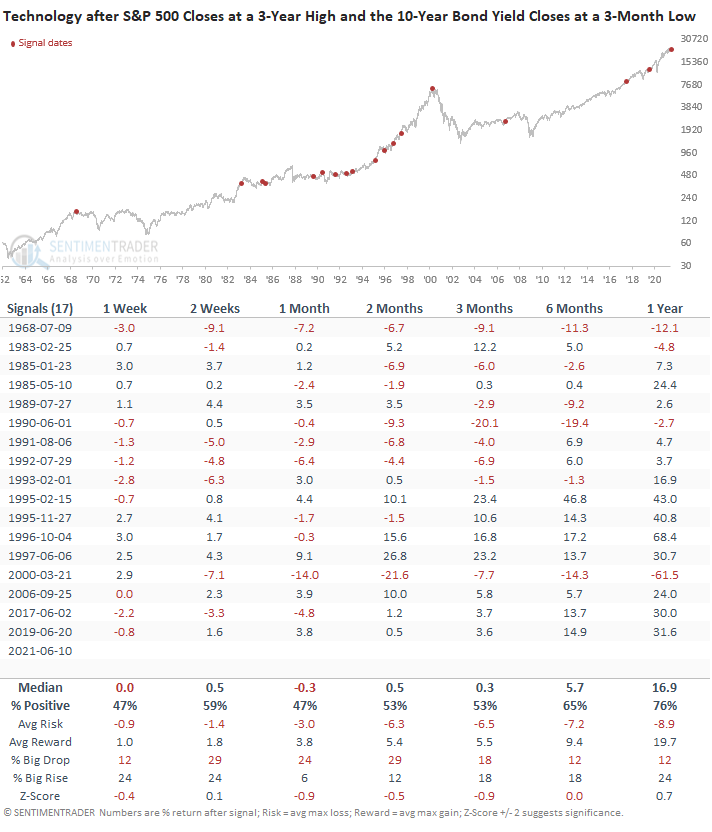
HOW THE SIGNALS PERFORMED - TECHNOLOGY

Technology returns were weak on almost all timeframes. However, one could argue that more recent instances were better.

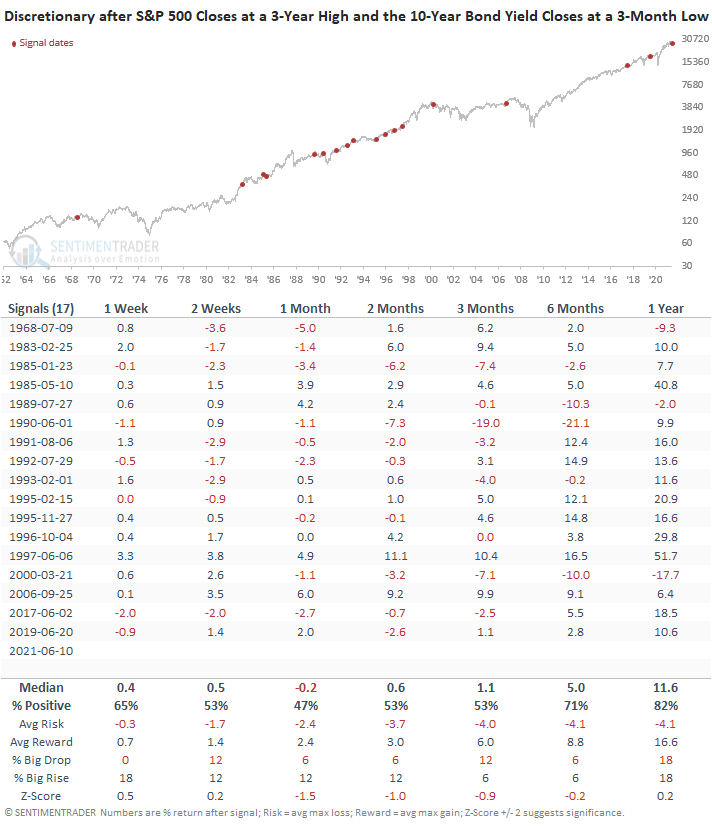
HOW THE SIGNALS PERFORMED - CONSUMER DISCRETIONARY

The short to intermediate-term returns look mixed to slightly weak with more constructive performance in the 12-month timeframe.

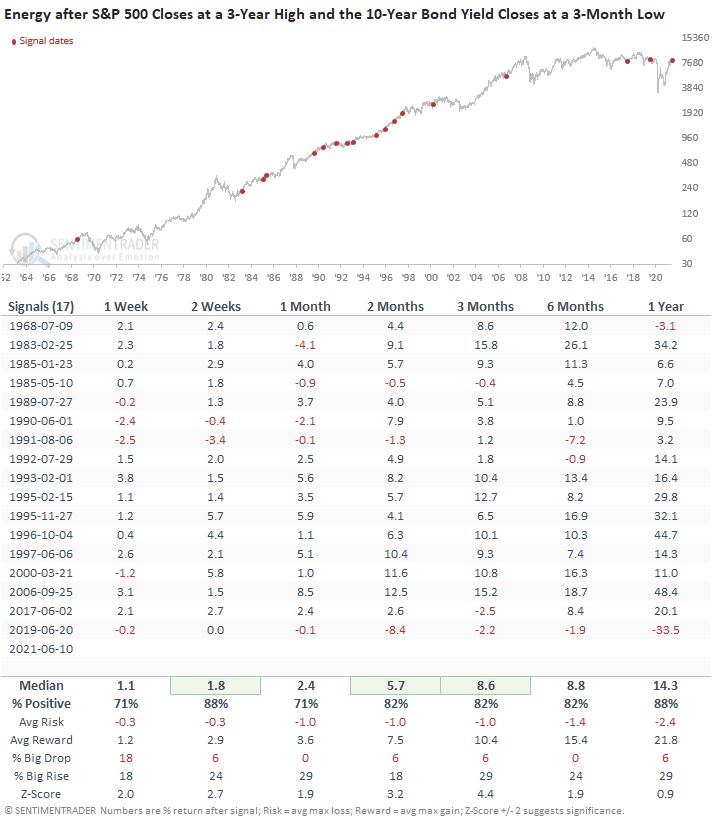
HOW THE SIGNALS PERFORMED - ENERGY

Energy performance looks solid on all timeframes.

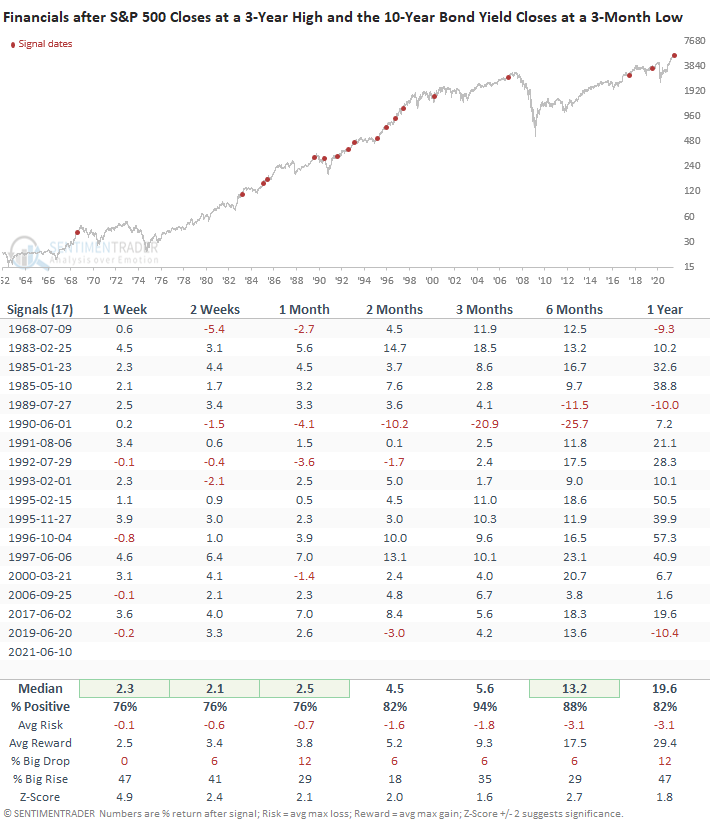
HOW THE SIGNALS PERFORMED - FINANCIALS

The Financials look fantastic on all timeframes. FYI, I had Jason double-check the numbers.

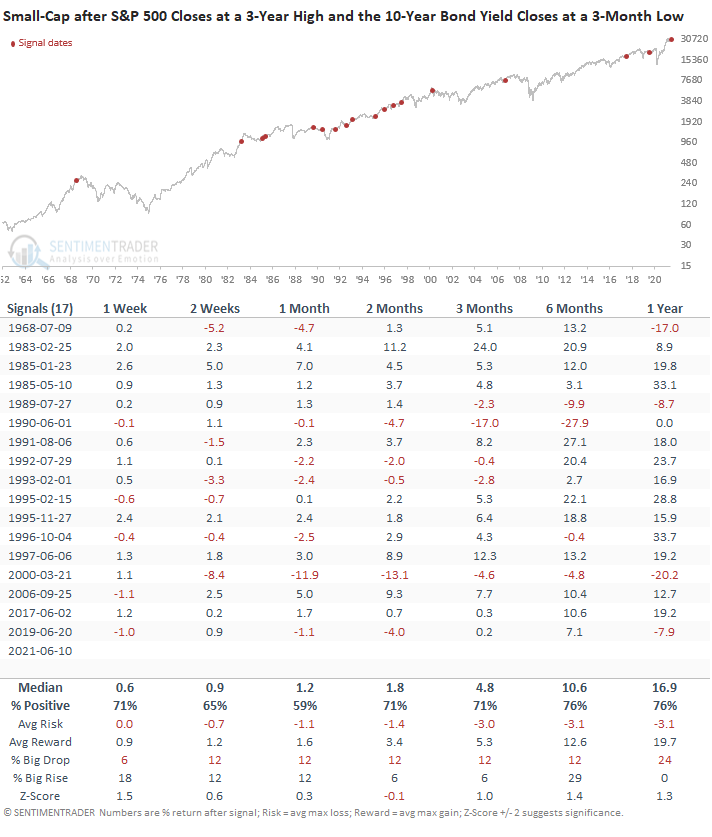
HOW THE SIGNALS PERFORMED - SMALL-CAP

Small-cap looks okay.

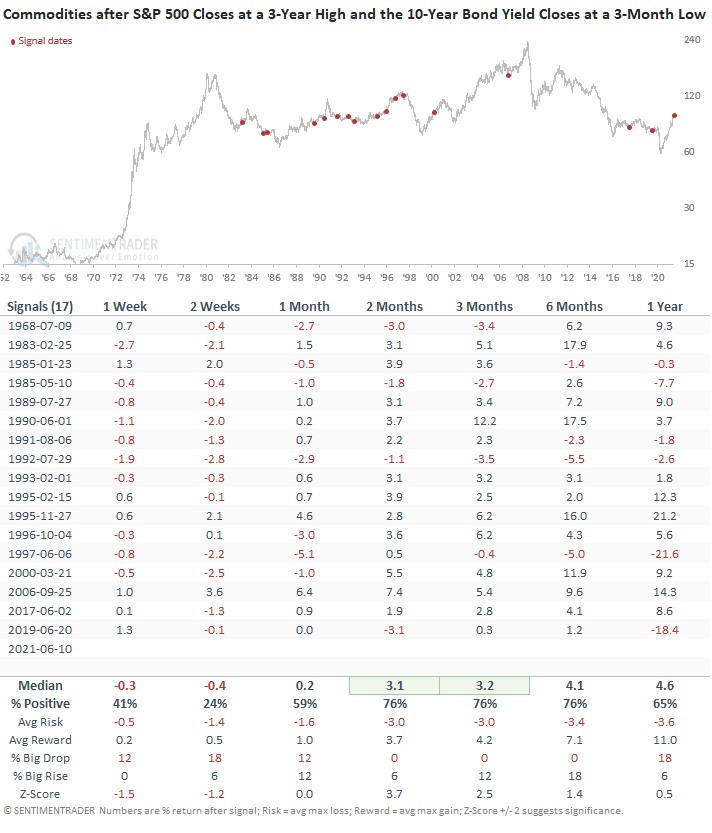
HOW THE SIGNALS PERFORMED - BLOOMBERG COMMODITY INDEX

Commodities look weak in the short-term, with better results in the 2-12 month timeframe.

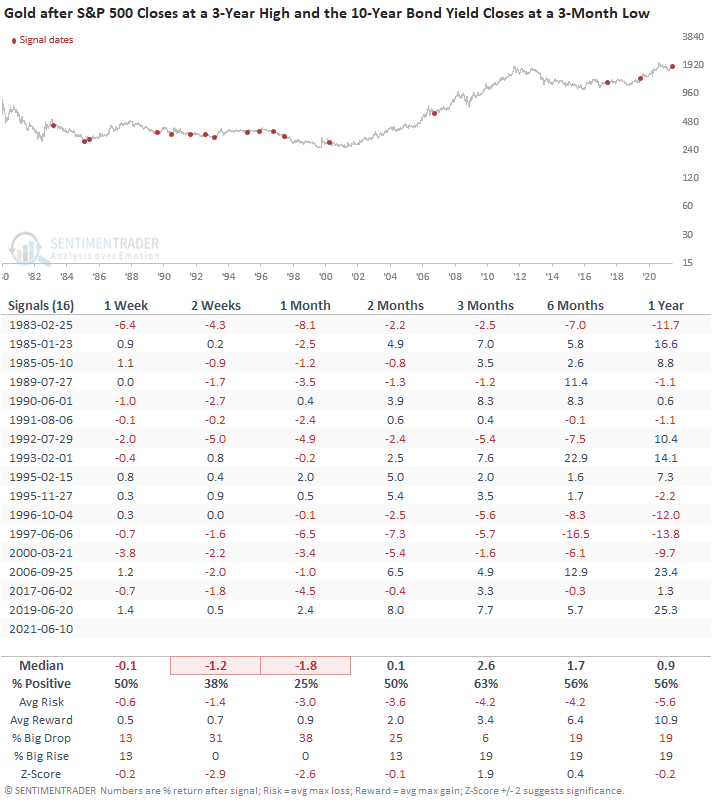
HOW THE SIGNALS PERFORMED - GOLD

Gold looks consistently weak on almost all timeframes. Due to data limitations, gold has one less signal.

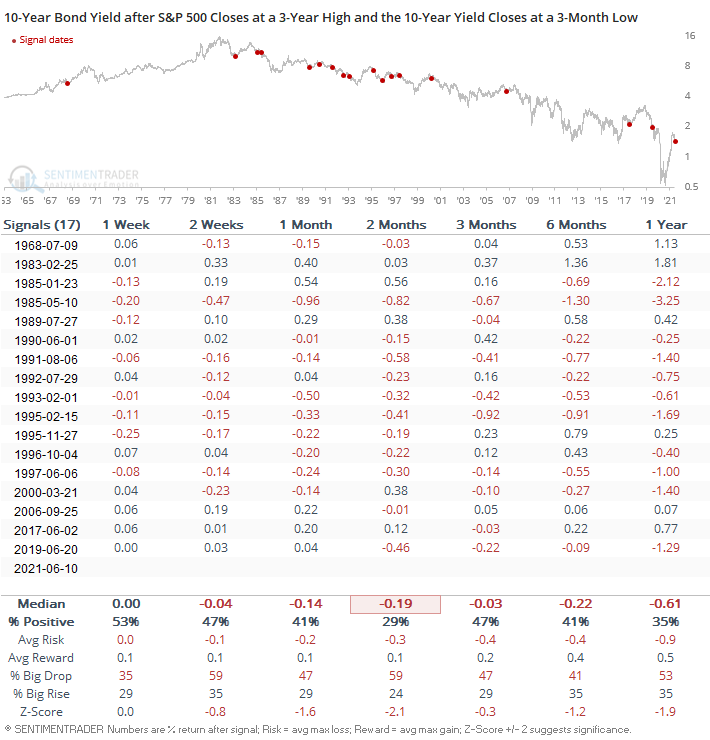
HOW THE SIGNALS PERFORMED - 10-YEAR YIELD

Bond yields consistently moved lower across almost all timeframes. I would note that all but one instance occurred during the long bond bull market that started in 1980.

History suggests that the move lower in bond yields implies slower growth. Therefore, we should be thinking about rotating out of value/cyclical stocks and into growth-oriented issues. Based on the following study, the historical evidence suggests otherwise. However, we need to keep in mind that several instances occurred in a relatively narrow timeframe.

Sorry, you don't have access to this report

Upgrade your subscription plan to get access
Go to Dasboard
DATA &
TECHnologies
IndicatorEdge
‍
BackTestEdge
‍
Other Tools
‍
DataEdge API
RESEARCH
reports
Research Solution
‍
Reports Library
‍
actionable
Strategies
Trading Strategies
‍
Smart Stock Scanner
‍
FREE
RESOUrCES
Simple Backtest
Calculator
Simple Seasonality
Calculator
The Kelly Criterion
Calculator
Sentiment Geo Map
‍
Public Research Reports
‍
Free Webinar
COMPANY
‍
About
‍
Meet our Team
‍
In the News
‍
Testimonials
‍
Client Success Stories
Pricing
Bundle pricing
‍
Announcements
‍
FAQ
© 2024 Sundial Capital Research Inc. All rights reserved.
Setsail Marketing
TermsPrivacyAffiliate Program
Risk Disclosure: Futures and forex trading contains substantial risk and is not for every investor. An investor could potentially lose all or more than the initial investment. Risk capital is money that can be lost without jeopardizing ones’ financial security or life style. Only risk capital should be used for trading and only those with sufficient risk capital should consider trading. Past performance is not necessarily indicative of future results.

Hypothetical Performance Disclosure: Hypothetical performance results have many inherent limitations, some of which are described below. No representation is being made that any account will or is likely to achieve profits or losses similar to those shown; in fact, there are frequently sharp differences between hypothetical performance results and the actual results subsequently achieved by any particular trading program. One of the limitations of hypothetical performance results is that they are generally prepared with the benefit of hindsight. In addition, hypothetical trading does not involve financial risk, and no hypothetical trading record can completely account for the impact of financial risk of actual trading. for example, the ability to withstand losses or to adhere to a particular trading program in spite of trading losses are material points which can also adversely affect actual trading results. There are numerous other factors related to the markets in general or to the implementation of any specific trading program which cannot be fully accounted for in the preparation of hypothetical performance results and all which can adversely affect trading results.

Testimonial Disclosure: Testimonials appearing on this website may not be representative of other clients or customers and is not a guarantee of future performance or success.