
Stocks thrust from oversold to overbought, triggering a buy signal

Key points:
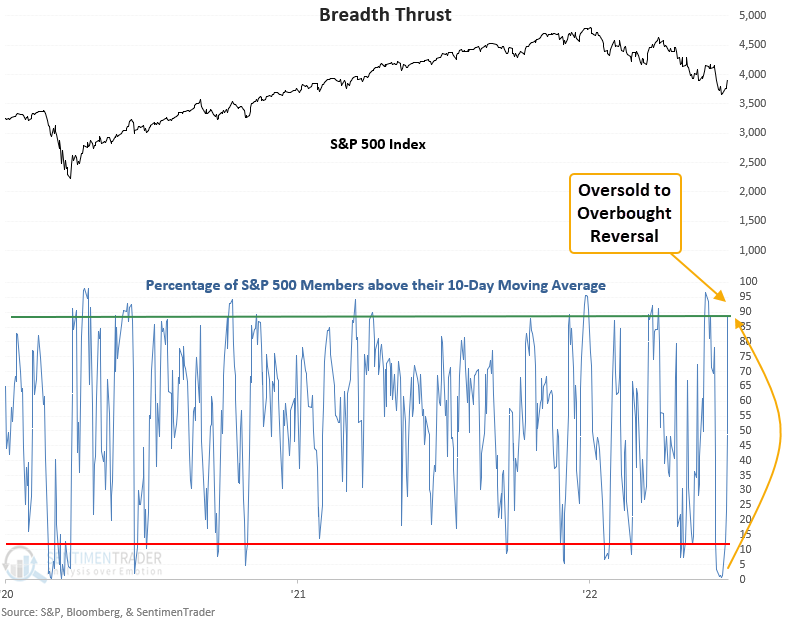
- S&P 500 members trading above their 10-day average surged from < 2% to > 88%
- The oversold to overbought reversal occurred in only 4 sessions
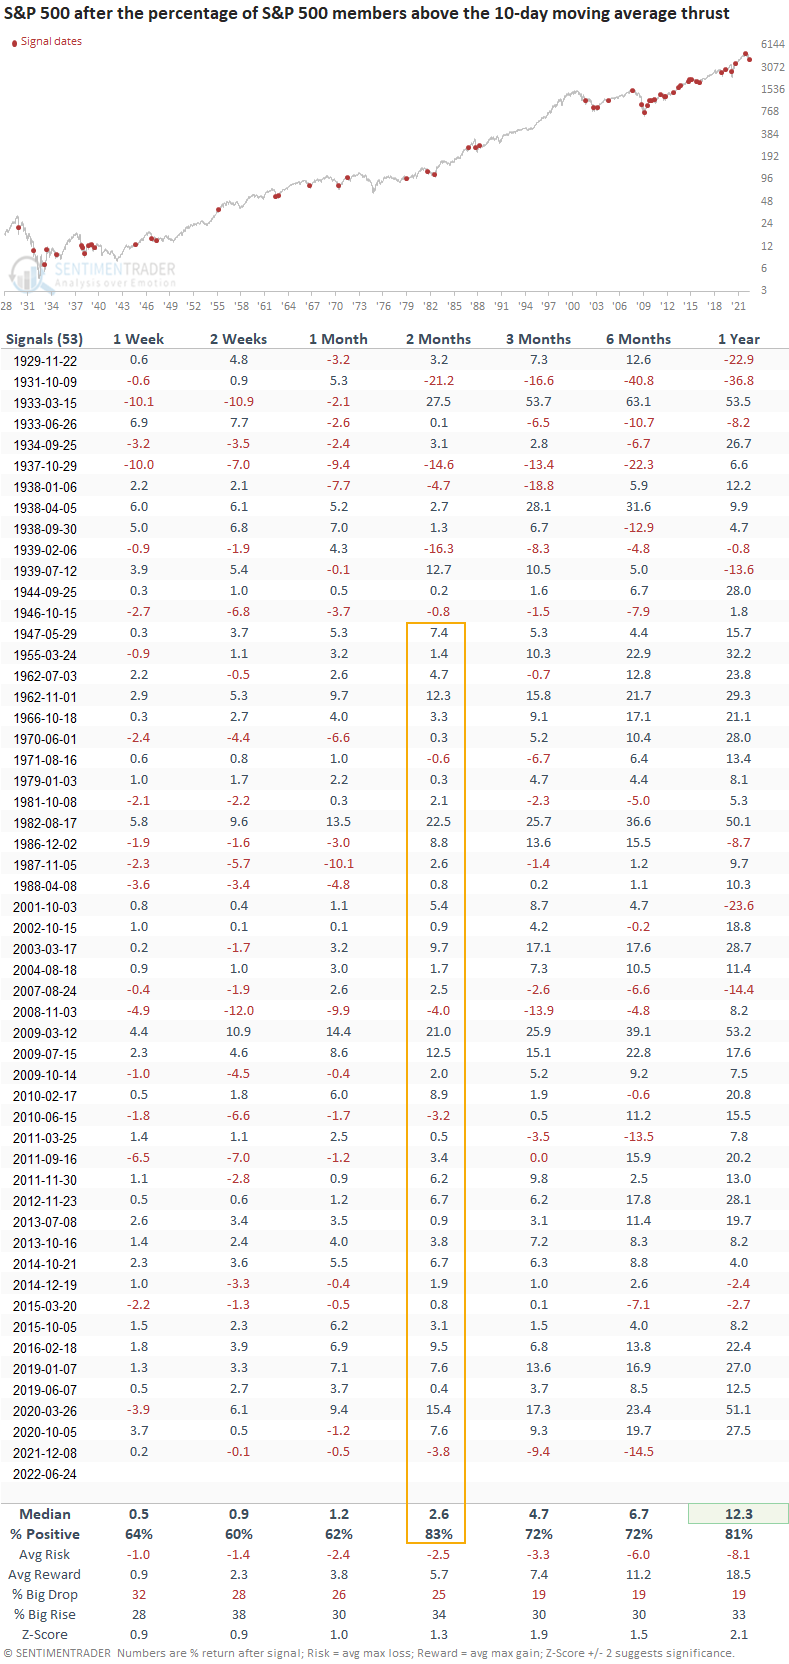
- The S&P 500 rallied 83% of the time over the next 2 months after other signals
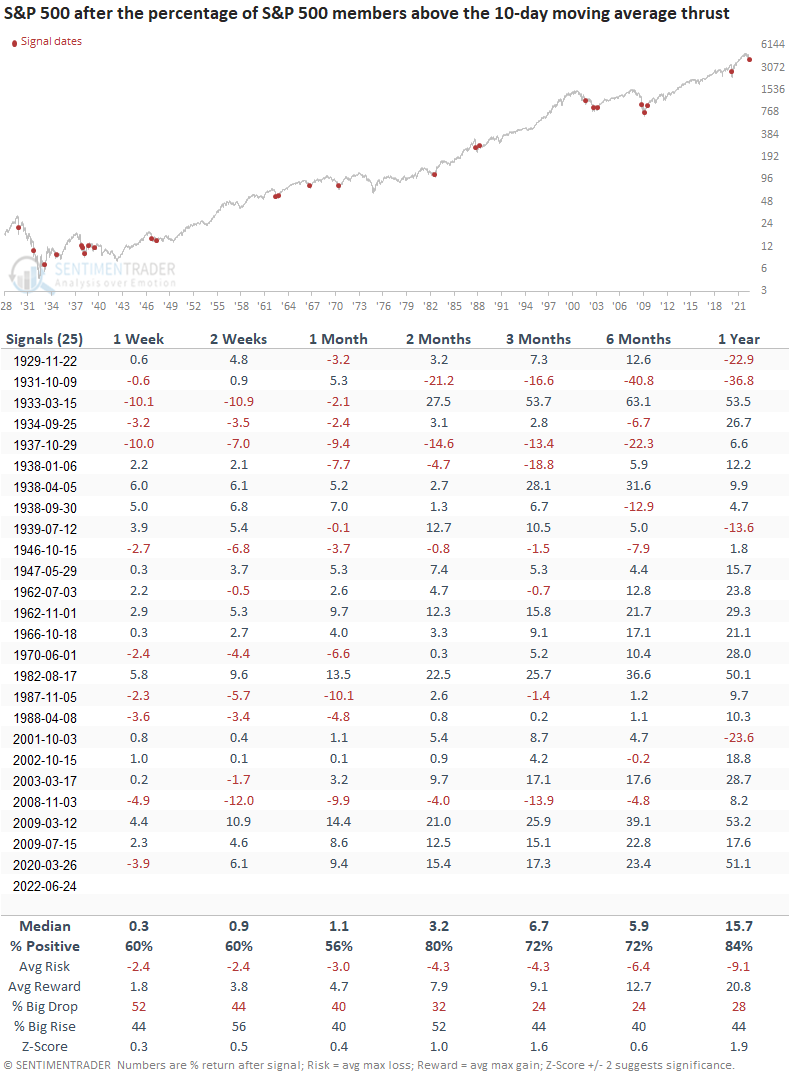
- Signals associated with a bear market rallied 80% of the time over the next 2 months
A short duration breadth indicator reverses higher
A new signal from a voting member in the TCTM Composite Thrust Model issued an alert at the close of trading on Friday. The component is called the percentage of members above the 10-day reversal model.
The algorithm identifies when the number of members trading above the 10-day moving average cycles from oversold to overbought in a brief period.
Sharp and sudden upward shifts in participation are historically bullish
The number of S&P 500 members above the 10-day moving average reversed from < 2% to > 88% in only 4 sessions. That's one of the swiftest reversals in history. I published a note on 12/9/21 for the previous reversal signal, which at one point had a maximum profit of 2.83%. However, shortly after, financial conditions tightened as the Federal Reserve shifted to a less accommodative policy and the signal succumbed to the market drawdown.
Similar signals preceded gains 83% of the time
This model generated a signal 53 other times over the past 93 years. After the others, future returns and win rates were solid across all time frames. The 2-month time frame shows 36 out of 40 winners since 1947. Unfortunately, the 15-signal win streak in the 2-month window ended with the alert from last December.
Signals associated with a bear market (down 20% or more from peak)
If I isolate instances based on whether they occurred within the context of a bear market, the model generated a signal 25 other times in the last 93 years. After the others, future returns and win rates were solid across all time frames. Once again, the 2-month window provides the best outlook for a near-term bounce.
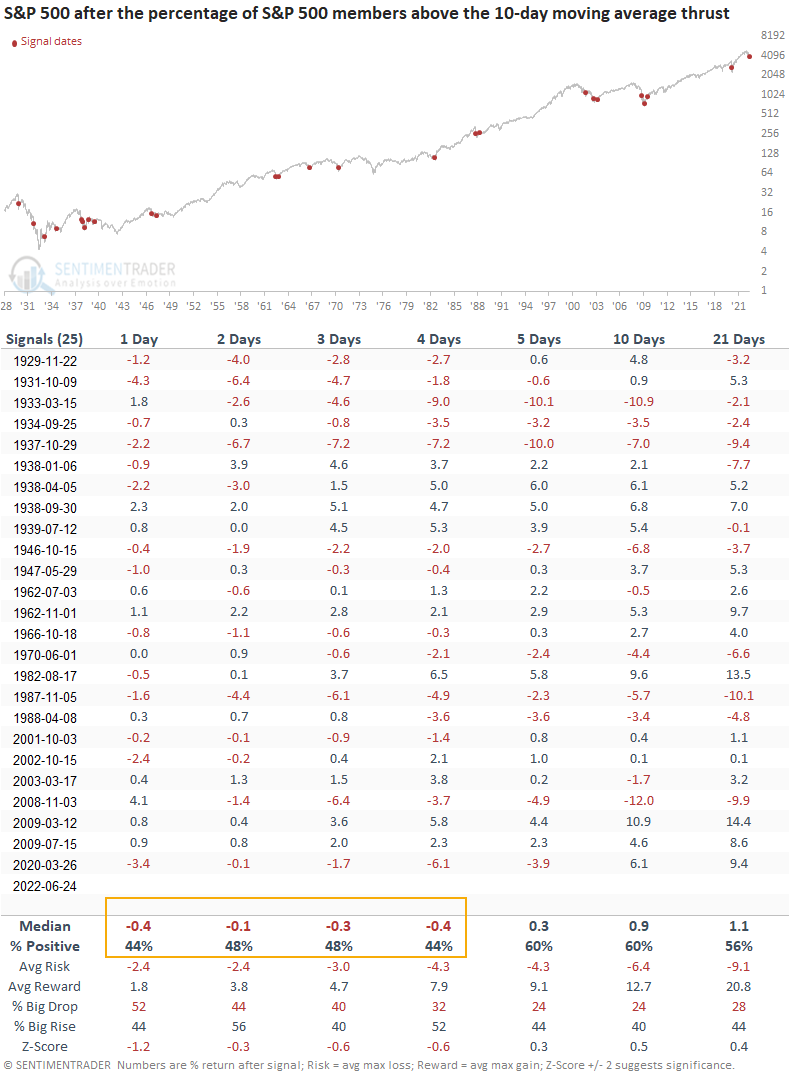
Signals associated with a bear market (down 20% or more from peak)
Let's apply the bear market signals to the short-term outlook table. In that case, the 1-4 day time frames suggest the S&P 500 could digest the recent gains in the next few days.
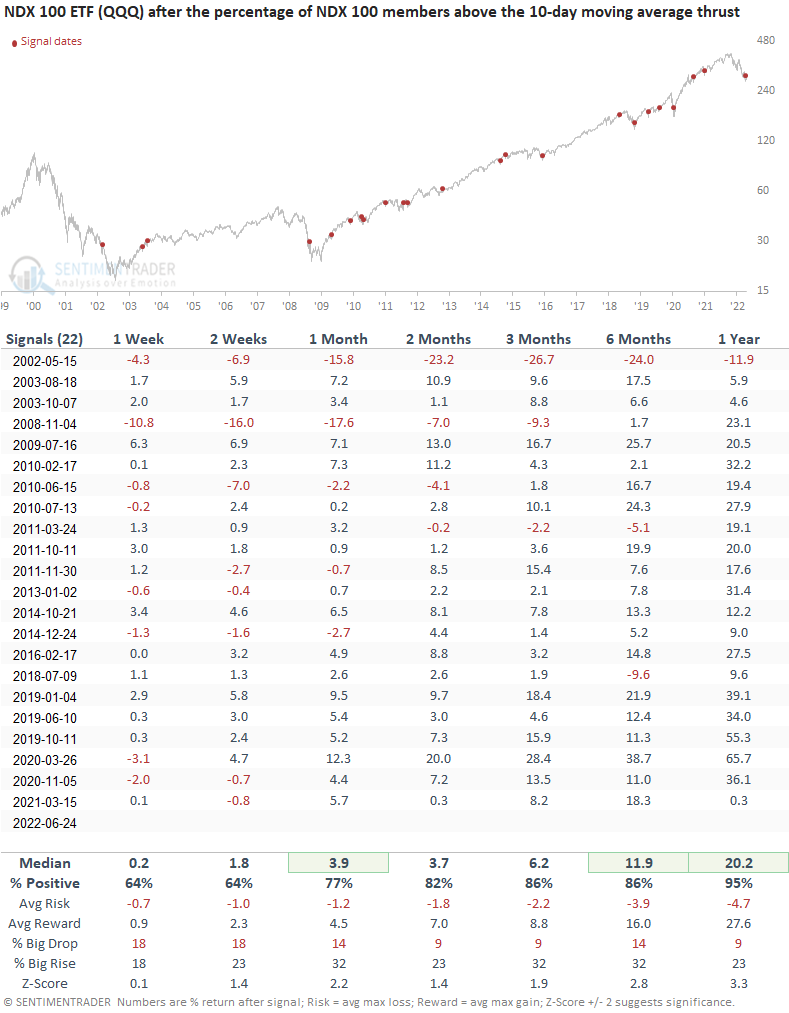
The Nasdaq 100 also triggered a 10-day moving average reversal signal
I apply the 10-day moving average reversal concept to several other indexes and sectors. The Nasdaq 100 triggered an alert on Friday when the number of members above the 10-day average cycled from < 7% to > 90% in 7 sessions or fewer. While the outlook for the technology-heavy index appears excellent, we need to remember that most instances occurred in bull market environments. The two bear market signals show significant drawdowns in the 1-month window.
What the research tells us...
When the percentage of members trading above the 10-day moving average reverses from oversold to overbought in a brief period, positive price momentum begets more positive momentum. Similar setups to what we're seeing now have preceded solid performance and win rates across all time frames, especially in the 2-month window. The results look good when I isolate bear market signals, which is the case now. However, the S&P 500 could digest the recent gains in the next few days. And, it's not just S&P 500 members that have reversed from oversold to overbought. The NDX 100 also triggered an alert on Friday. Because Federal Reserve policy remains unfriendly, traders should maintain tight stops and take quick profits. i.e., if you buy-the-dip, sell-the-rip.