Data &
Technology
Research
Reports
Report Solutions
Reports Library
Actionable
Strategies
Free
Resources
Simple Backtest Calculator
Simple Seasonality Calculator
The Kelly Criterion Calculator
Sentiment Geo Map
Public Research Reports
Free Webinar
Pricing
Company
About
Meet Our Team
In the News
Testimonials
Client Success Stories
Contact
Log inLoginSign up
< BACK TO ALL REPORTS

Stocks struggling as breadth recovers

Jason Goepfert
2020-04-15
The High Low Ratios for the NYSE and Nasdaq have recovered to move above 50% for the first time in months, following extremely depressed readings. That has also caused the HiLo Logic Index to curl up, and recent thrusts are not due solely to "little mover" stocks.

We've spent a lot of time going over extremes in breadth over the past month. They were the most compelling metrics on the way down, with the most lopsided selling pressure in history, and on the way up, with some of the best breadth thrusts in history.

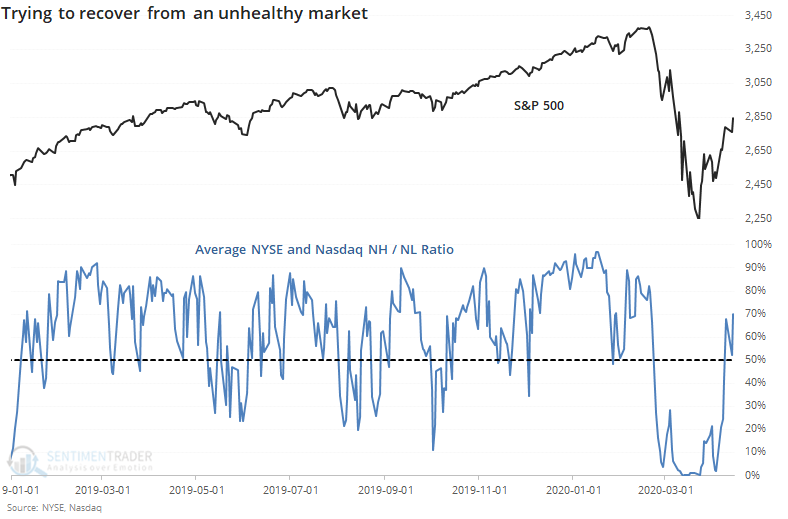
As Troy mentioned in a premium note, stocks on the Nasdaq have recovered enough so that the 52-week New High / New Low Ratio has recovered above 50%, after falling to 0% at some point in the past couple of months. Something similar occurred on the NYSE, with its ratio also recovering from an extremely low level.

The average of the two ratios has gone from less than 1% to more than 50% very quickly. Like most oscillating ratios like this, healthy markets typically hold above 50%, with only brief forays into oversold territory. Unhealthy markets see the inverse, and by the close on Wednesday this figure dropped back below 50%. Bulls should want to see this pop back above 50% in the coming days.

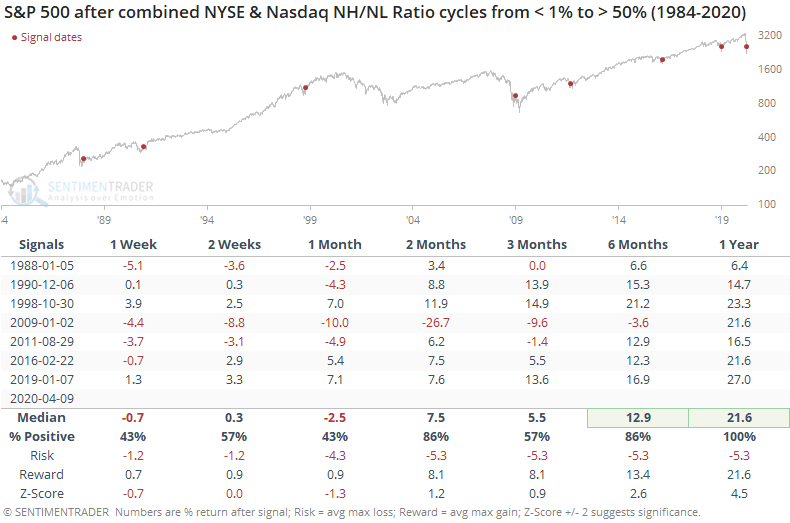
As Troy noted, when the Nasdaq ratio has cycled from essentially 0 to 50%, it's been a very good sign for the Nasdaq. When we look at a combined ratio, it's also been a good long-term sign, though with some heavy shorter-term volatility.

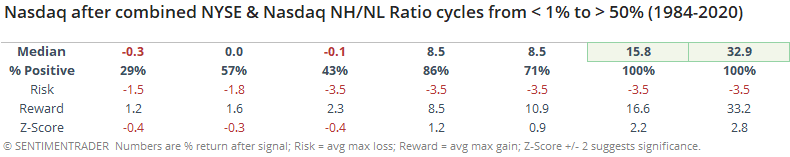
Returns for the Nasdaq were more impressive, with an average gain of over 32% during the next year.

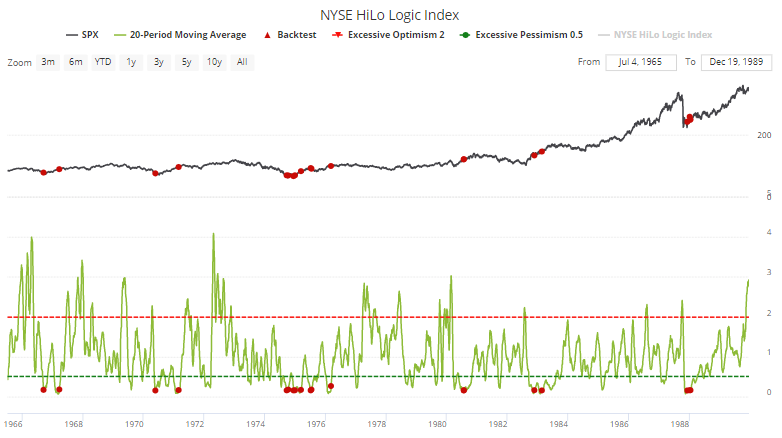
The extreme domination of stocks falling to 52-week lows in March caused the HiLo Logic Index to plunge to a near-record low. Now that highs are starting to outnumber lows, the 20-day average of the index is finally starting to curl higher. The Backtest Engine shows very good 6-12 month returns for the S&P 500 when this happened before.

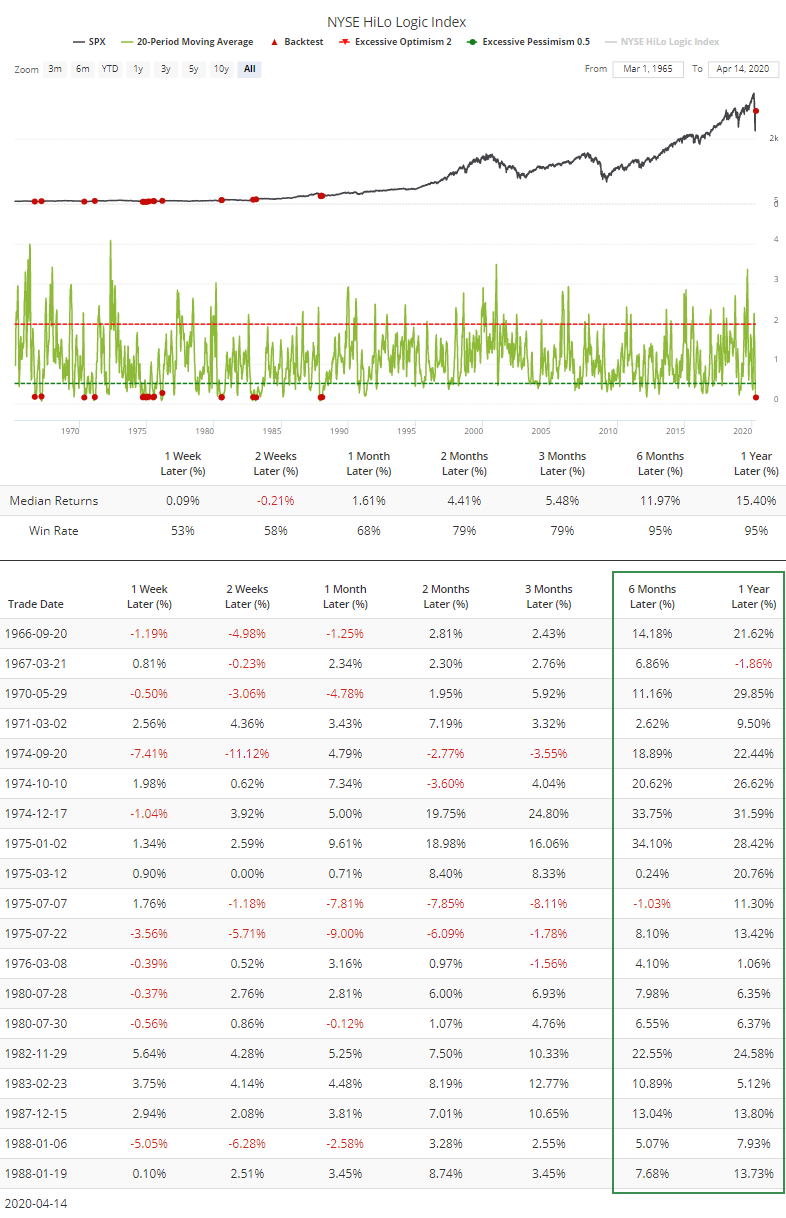
Most of those triggered in the 1970s and early '80s.

One of the knocks against the thrusts we've seen is that it could be due to computerized trading. There have been a lot of days with an overwhelming number of securities advancing, but perhaps a lot of those daily gainers are from stocks that only moved up a few cents.

To check, the chart below shows the S&P 500's 10-day Up Issues Ratio in blue. This compares each day's advancing stocks to the total number of advancing and declining stocks, no matter how much they advanced or declined each day. The red line is the same ratio, but only includes stocks that rose or fell more than 0.5% each day, so it excludes any stock that showed a small gain or loss.

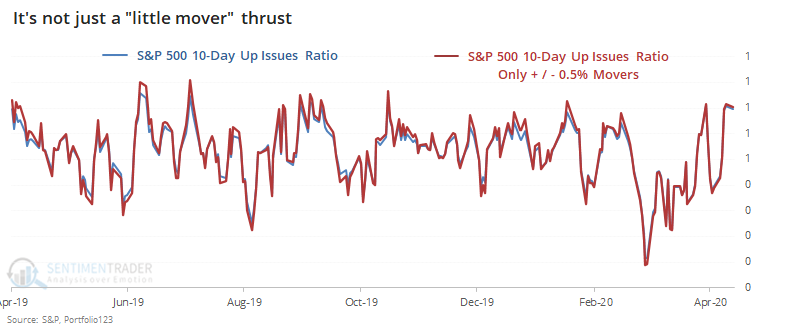
There is virtually no difference between the ratios, which suggests that the current thrust is not due to a bunch of stocks showing small gains.

As most stocks attempt to recover from the March devastation, we're seeing more and more metrics return to a neutral level. That has caused some issues during prolonged bear markets, and it's something to watch for here. During recoveries from some of the worst sell-offs in history, these initial recoveries often led to some short-term whipsaws, but not major retracements.

Sorry, you don't have access to this report

Upgrade your subscription plan to get access
Go to Dasboard
DATA &
TECHnologies
IndicatorEdge
‍
BackTestEdge
‍
Other Tools
‍
DataEdge API
RESEARCH
reports
Research Solution
‍
Reports Library
‍
actionable
Strategies
Trading Strategies
‍
Smart Stock Scanner
‍
FREE
RESOUrCES
Simple Backtest
Calculator
Simple Seasonality
Calculator
The Kelly Criterion
Calculator
Sentiment Geo Map
‍
Public Research Reports
‍
Free Webinar
COMPANY
‍
About
‍
Meet our Team
‍
In the News
‍
Testimonials
‍
Client Success Stories
Pricing
Bundle pricing
‍
Announcements
‍
FAQ
© 2024 Sundial Capital Research Inc. All rights reserved.
Setsail Marketing
TermsPrivacyAffiliate Program
Risk Disclosure: Futures and forex trading contains substantial risk and is not for every investor. An investor could potentially lose all or more than the initial investment. Risk capital is money that can be lost without jeopardizing ones’ financial security or life style. Only risk capital should be used for trading and only those with sufficient risk capital should consider trading. Past performance is not necessarily indicative of future results.

Hypothetical Performance Disclosure: Hypothetical performance results have many inherent limitations, some of which are described below. No representation is being made that any account will or is likely to achieve profits or losses similar to those shown; in fact, there are frequently sharp differences between hypothetical performance results and the actual results subsequently achieved by any particular trading program. One of the limitations of hypothetical performance results is that they are generally prepared with the benefit of hindsight. In addition, hypothetical trading does not involve financial risk, and no hypothetical trading record can completely account for the impact of financial risk of actual trading. for example, the ability to withstand losses or to adhere to a particular trading program in spite of trading losses are material points which can also adversely affect actual trading results. There are numerous other factors related to the markets in general or to the implementation of any specific trading program which cannot be fully accounted for in the preparation of hypothetical performance results and all which can adversely affect trading results.

Testimonial Disclosure: Testimonials appearing on this website may not be representative of other clients or customers and is not a guarantee of future performance or success.