Data &
Technology
Research
Reports
Report Solutions
Reports Library
Actionable
Strategies
Free
Resources
Simple Backtest Calculator
Simple Seasonality Calculator
The Kelly Criterion Calculator
Sentiment Geo Map
Public Research Reports
Free Webinar
Pricing
Company
About
Meet Our Team
In the News
Testimonials
Client Success Stories
Contact
Log inLoginSign up
< BACK TO ALL REPORTS

Stocks, Oil Diverge As Corrections Spike

Jason Goepfert
2020-02-05
Stocks are near highs while crude oil hits a 52-week low. The percentage of S&P 500 stocks in correction territory has spiked.

Diverging markets

Stocks surged again and neared (or hit) 52-week highs, yet crude oil fell again and closed at a 52-week low. Typically, there is more of a positive correlation between them.

S&P 500 versus crude oil

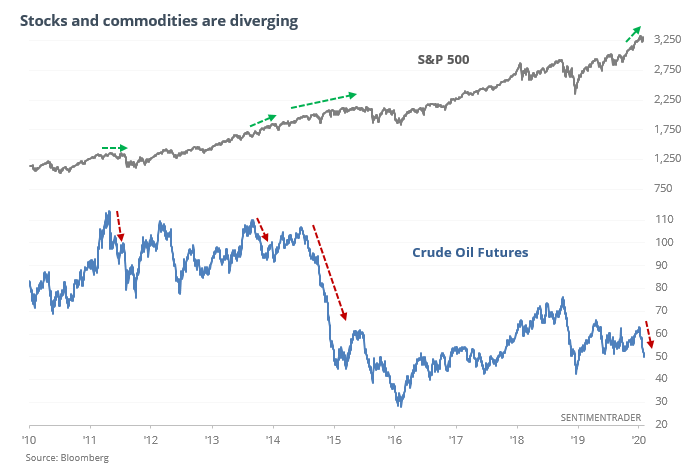
Going back to 1985, when oil diverged so much from stocks, it led to mixed returns for stocks, with slight weakness shorter-term. It was mostly the same for oil prices.

The last two signals, in 2007, and 2014, proved to be more worrisome. After those, the S&P 500 declined over the next 1-2 months, and also over the next year.


Fewer Corrections

The percentage of S&P 500 stocks in a correction, more than 10% below 52 week highs, fell over the past few months to the lowest level since early-2018 as the stock market rallied.

Various studies demonstrated that when this happened in the past, the S&P's returns over the next 6-12 months were mostly bearish since this typically happened after a major correction or a bear market:

Percentage of S&P 500 stocks in a correction

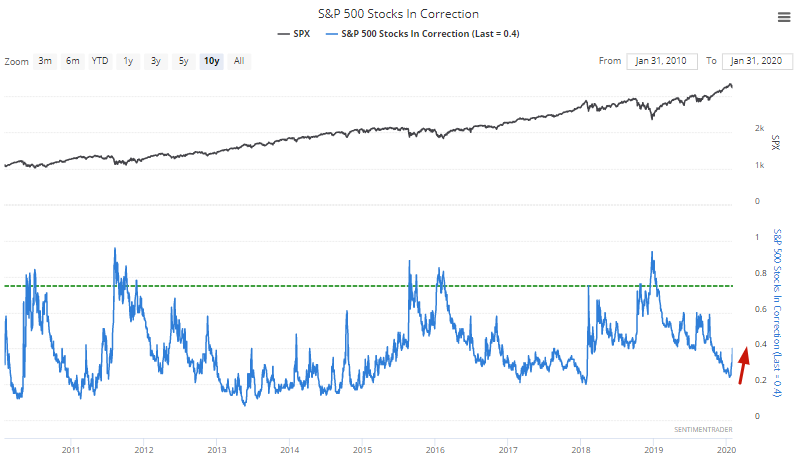
But as the S&P made a recent pullback, the % of stocks in a correction jumped more than 15%. When this figure hit a 400 day low and then jumped more than 15% over the next 2 weeks, the S&P typically rallied over the next month.

S&P 500 stocks in a correction rebounds

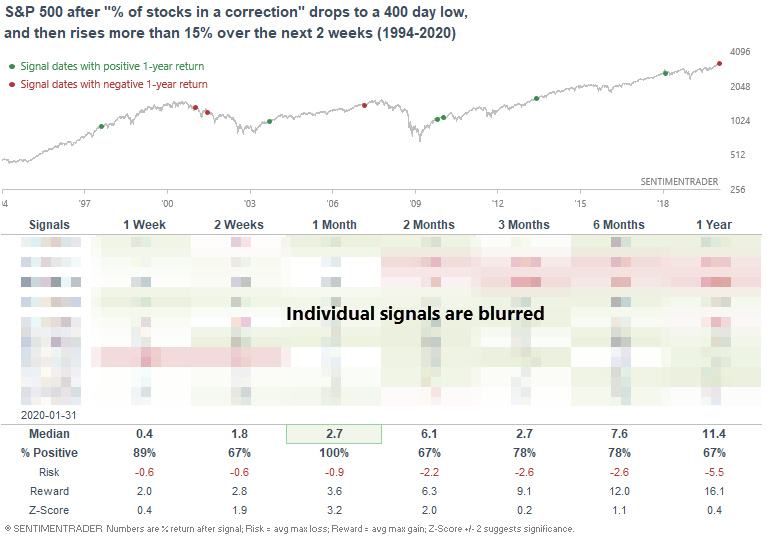
 In a bull market this is typical when the market experiences a period of strong momentum and then makes a quick pullback.

This is an abridged version of our recent reports and notes. For immediate access with no obligation, sign up for a 30-day free trial now.

We also looked at:

  • The Nasdaq's quick recovery from a shallow pullback
  • Yet more technical warning signs
  • Short-term breadth panic in emerging markets
  • What happens after copper ends a historic losing streak
  • Oil producer sentiment is historically pessimistic
DATA &
TECHnologies
IndicatorEdge
‍
BackTestEdge
‍
Other Tools
‍
DataEdge API
RESEARCH
reports
Research Solution
‍
Reports Library
‍
actionable
Strategies
Trading Strategies
‍
Smart Stock Scanner
‍
FREE
RESOUrCES
Simple Backtest
Calculator
Simple Seasonality
Calculator
The Kelly Criterion
Calculator
Sentiment Geo Map
‍
Public Research Reports
‍
Free Webinar
COMPANY
‍
About
‍
Meet our Team
‍
In the News
‍
Testimonials
‍
Client Success Stories
Pricing
Bundle pricing
‍
Announcements
‍
FAQ
© 2024 Sundial Capital Research Inc. All rights reserved.
Setsail Marketing
TermsPrivacyAffiliate Program
Risk Disclosure: Futures and forex trading contains substantial risk and is not for every investor. An investor could potentially lose all or more than the initial investment. Risk capital is money that can be lost without jeopardizing ones’ financial security or life style. Only risk capital should be used for trading and only those with sufficient risk capital should consider trading. Past performance is not necessarily indicative of future results.

Hypothetical Performance Disclosure: Hypothetical performance results have many inherent limitations, some of which are described below. No representation is being made that any account will or is likely to achieve profits or losses similar to those shown; in fact, there are frequently sharp differences between hypothetical performance results and the actual results subsequently achieved by any particular trading program. One of the limitations of hypothetical performance results is that they are generally prepared with the benefit of hindsight. In addition, hypothetical trading does not involve financial risk, and no hypothetical trading record can completely account for the impact of financial risk of actual trading. for example, the ability to withstand losses or to adhere to a particular trading program in spite of trading losses are material points which can also adversely affect actual trading results. There are numerous other factors related to the markets in general or to the implementation of any specific trading program which cannot be fully accounted for in the preparation of hypothetical performance results and all which can adversely affect trading results.

Testimonial Disclosure: Testimonials appearing on this website may not be representative of other clients or customers and is not a guarantee of future performance or success.