Data &
Technology
Research
Reports
Report Solutions
Reports Library
Actionable
Strategies
Free
Resources
Simple Backtest Calculator
Simple Seasonality Calculator
The Kelly Criterion Calculator
Sentiment Geo Map
Public Research Reports
Free Webinar
Pricing
Company
About
Meet Our Team
In the News
Testimonials
Client Success Stories
Contact
Log inLoginSign up
< BACK TO ALL REPORTS

Stocks have uncoupled from the dollar

Jason Goepfert
2020-06-26
During the height of the pandemic panic, stocks and the dollar moved in lockstep. The correlation between them has since broken down and turned to the most negative in years. That has not been a consistent sign of future strength in stocks (or the dollar or gold, for that matter).

Correlation and causation are a tricky pair, as we never really know if we can rely on one to suggest the other.

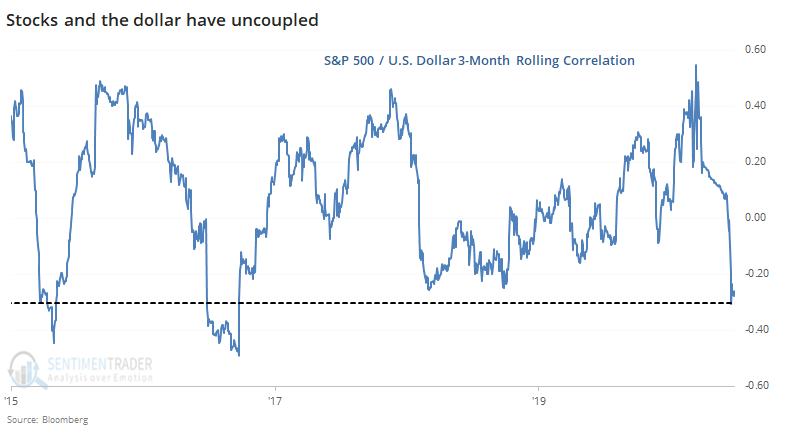
During the peak of pandemic panic in February and March, the correlation between stocks and the dollar was extremely high, as the economic forces on one seemed to be related to the other - mostly investors' perceptions about the influence of Federal Reserve actions.

As noted by the Financial Times:

"Strategists attribute the recent moves to the radical actions of central banks and governments to fend off the worst effects of the pandemic. Since the start of the Covid-19 crisis, interest rates in major economies have been slashed to near zero, wiping out an important metric for assessing currencies."

The rolling 3-month correlation between the two hit a 12-year high in March, then settled down as stocks rallied. Recently, it has dived, as they take their separate paths. Stocks have continued to rally while the dollar tanked.

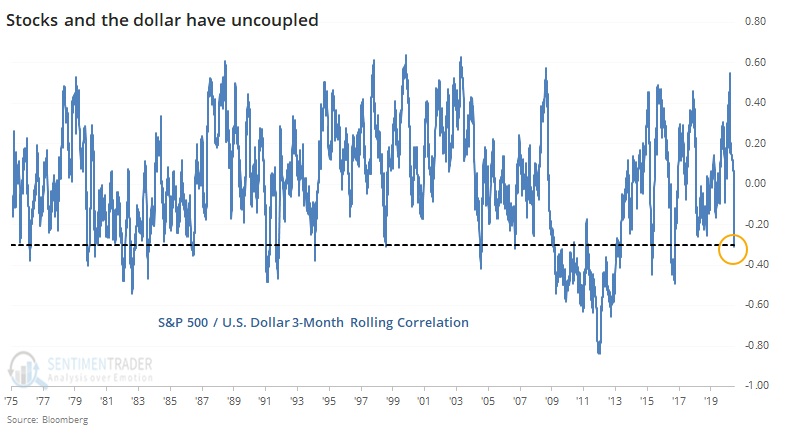
Going back to 1975, we can see that this large of a negative correlation between the two is unusual.

As for what it meant when the correlation first dropped below -0.3, it wasn't a great short- to medium-term sign for the S&P 500.

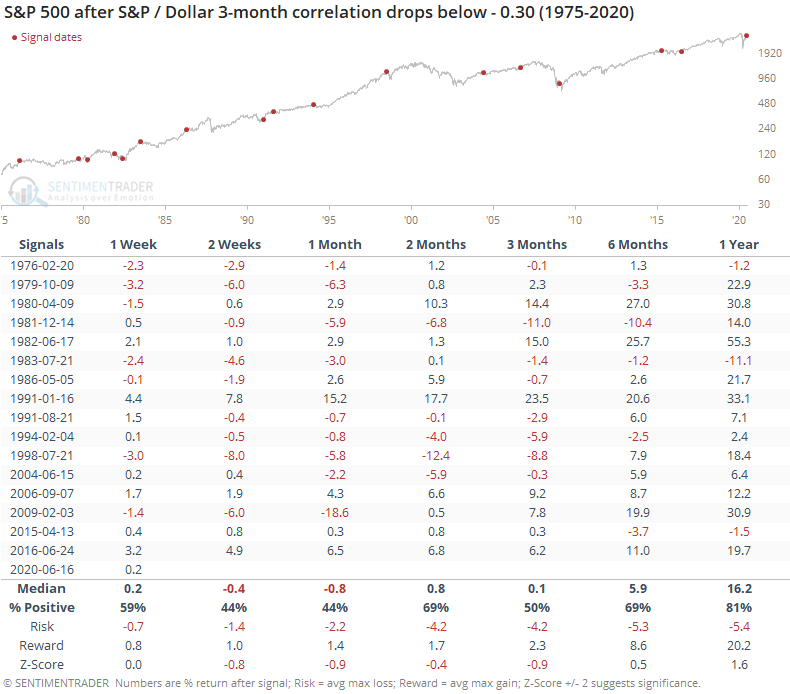
The S&P's median return was below average (a negative z-score) up to three months later, but it wasn't particularly large or consistent. The most worrisome part is the very poor risk/reward ratio, which was especially bad during the next two months.

It wasn't a great sign for the dollar, either.

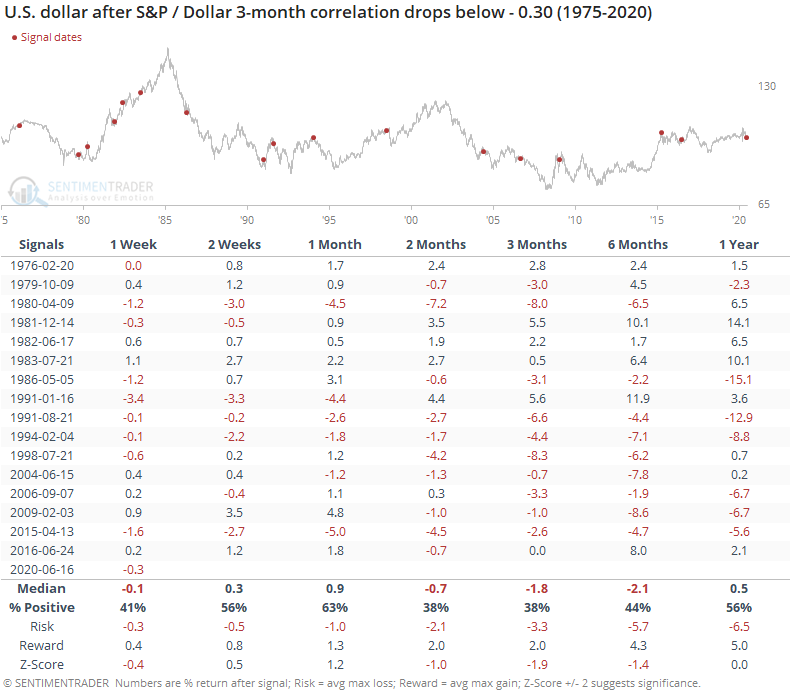
Over the next 2-3 months, the buck had a consistent tendency to decline, especially since late 1991. Every signal since then saw the dollar at a lower level either two or three months later.

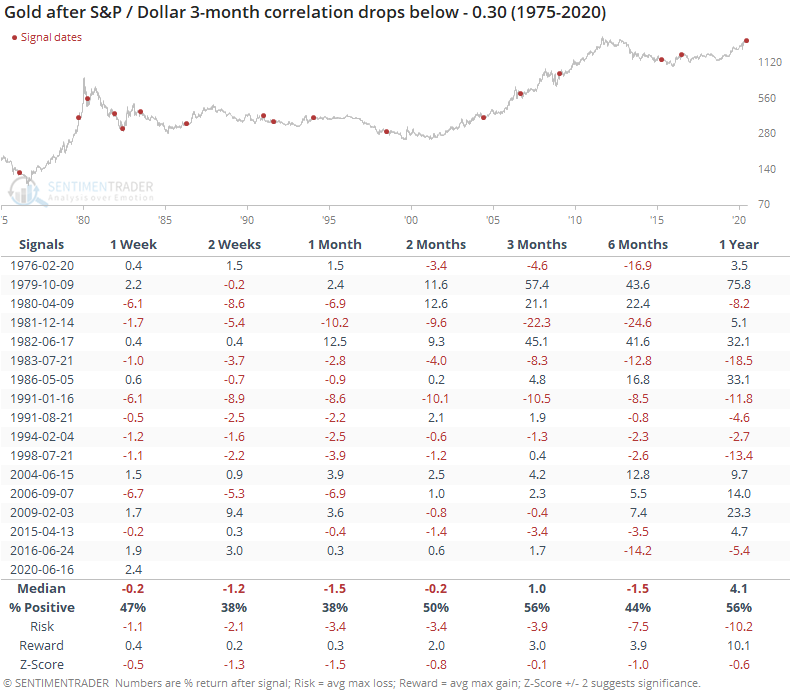
Gold often rallies when the dollar falls, but after these signals, the metal struggled shorter-term.

Intermarket correlations get a lot of attention among analysts and the media, but they're extremely hard to use since they change all the time. There aren't many markets that have had a consistent and predictable correlation over the decades. While it seems like it might be positive that stocks have uncoupled from the same forces driving the dollar, there isn't much evidence to support that historically.

Sorry, you don't have access to this report

Upgrade your subscription plan to get access
Go to Dasboard
DATA &
TECHnologies
IndicatorEdge
‍
BackTestEdge
‍
Other Tools
‍
DataEdge API
RESEARCH
reports
Research Solution
‍
Reports Library
‍
actionable
Strategies
Trading Strategies
‍
Smart Stock Scanner
‍
FREE
RESOUrCES
Simple Backtest
Calculator
Simple Seasonality
Calculator
The Kelly Criterion
Calculator
Sentiment Geo Map
‍
Public Research Reports
‍
Free Webinar
COMPANY
‍
About
‍
Meet our Team
‍
In the News
‍
Testimonials
‍
Client Success Stories
Pricing
Bundle pricing
‍
Announcements
‍
FAQ
© 2024 Sundial Capital Research Inc. All rights reserved.
Setsail Marketing
TermsPrivacyAffiliate Program
Risk Disclosure: Futures and forex trading contains substantial risk and is not for every investor. An investor could potentially lose all or more than the initial investment. Risk capital is money that can be lost without jeopardizing ones’ financial security or life style. Only risk capital should be used for trading and only those with sufficient risk capital should consider trading. Past performance is not necessarily indicative of future results.

Hypothetical Performance Disclosure: Hypothetical performance results have many inherent limitations, some of which are described below. No representation is being made that any account will or is likely to achieve profits or losses similar to those shown; in fact, there are frequently sharp differences between hypothetical performance results and the actual results subsequently achieved by any particular trading program. One of the limitations of hypothetical performance results is that they are generally prepared with the benefit of hindsight. In addition, hypothetical trading does not involve financial risk, and no hypothetical trading record can completely account for the impact of financial risk of actual trading. for example, the ability to withstand losses or to adhere to a particular trading program in spite of trading losses are material points which can also adversely affect actual trading results. There are numerous other factors related to the markets in general or to the implementation of any specific trading program which cannot be fully accounted for in the preparation of hypothetical performance results and all which can adversely affect trading results.

Testimonial Disclosure: Testimonials appearing on this website may not be representative of other clients or customers and is not a guarantee of future performance or success.