Data &
Technology
Research
Reports
Report Solutions
Reports Library
Actionable
Strategies
Free
Resources
Simple Backtest Calculator
Simple Seasonality Calculator
The Kelly Criterion Calculator
Sentiment Geo Map
Public Research Reports
Free Webinar
Pricing
Company
About
Meet Our Team
In the News
Testimonials
Client Success Stories
Contact
Log inLoginSign up
< BACK TO ALL REPORTS

Stocks Have Gone Absolutely Nowhere

Jason Goepfert
2019-08-20
null

This is an abridged version of our recent reports and notes. For immediate access with no obligation, sign up for a 30-day free trial now.

Going nowhere

The most benchmarked index in the world has gone nowhere for over a year and a half. The S&P 500 was just trading at the same level it was at in January 2018, not including dividends. This is not the return for investors, but rather the apathy anyone looking at a price chart would feel.

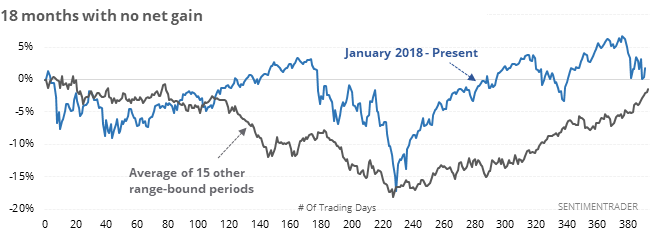
But there are some positive signs, like the fact that it’s in the upper end of its range and only modestly below its all-time high. Other times it went nowhere for so long, but remained relatively healthy, it broke out to the upside. All but one signal led to a higher return a year later.

Double thrust

Last week, the 10-day Up Volume Ratio on the NYSE sunk into oversold territory. When that happened in January, it was followed by enough positive days to trigger a breadth thrust. It’s too early this time around, but it’s off to a good start with back-to-back days enjoying heavy volume flowing into advancing securities.

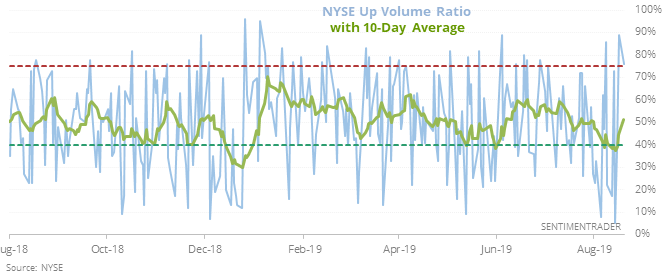
While big up days generate a lot of excitement and change the tone of mainstream media, they haven’t consistently been good short- to medium-term buy signals as stocks often took a breather at some point. More than anything, they were decent signs that the longer-term risk/reward ratio was becoming more positive.

90% days

On the S&P 500 more than 90% of stocks rose on both Friday and Monday. Since 1990, there have only been two other times the index enjoyed 90% of its stocks rising – December 18, 2014, and August 27, 2015.

Dumb money and oversold yields

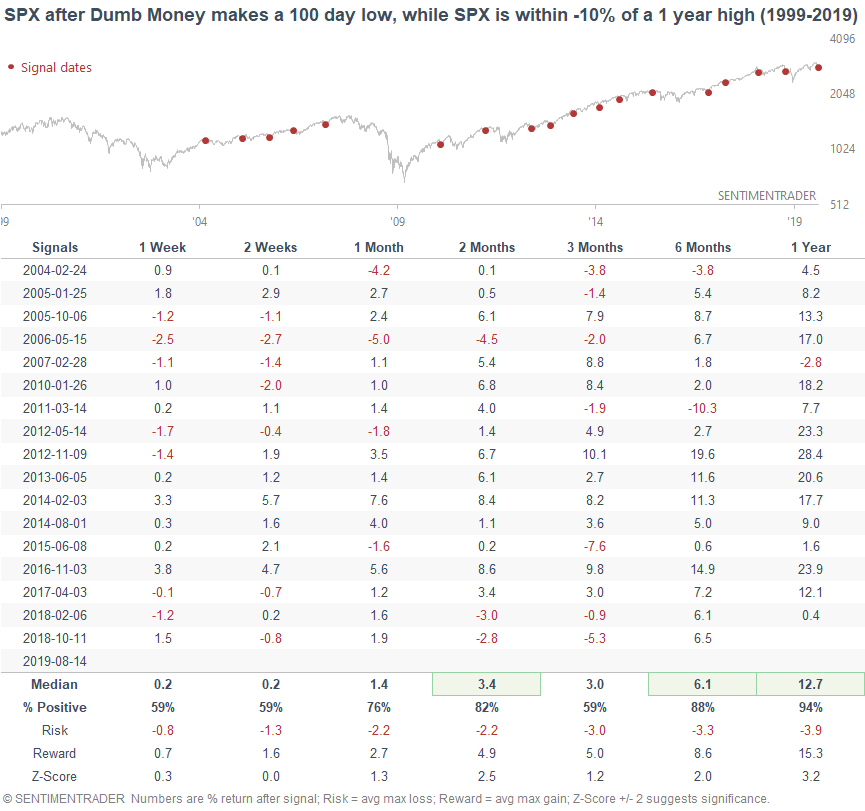
In a weekly review, Troy pointed out that Dumb Money Confidence fell to a 100-day low even while the S&P was within 10% of its peak. That preceded gains in the index 94% of the time over the next year.

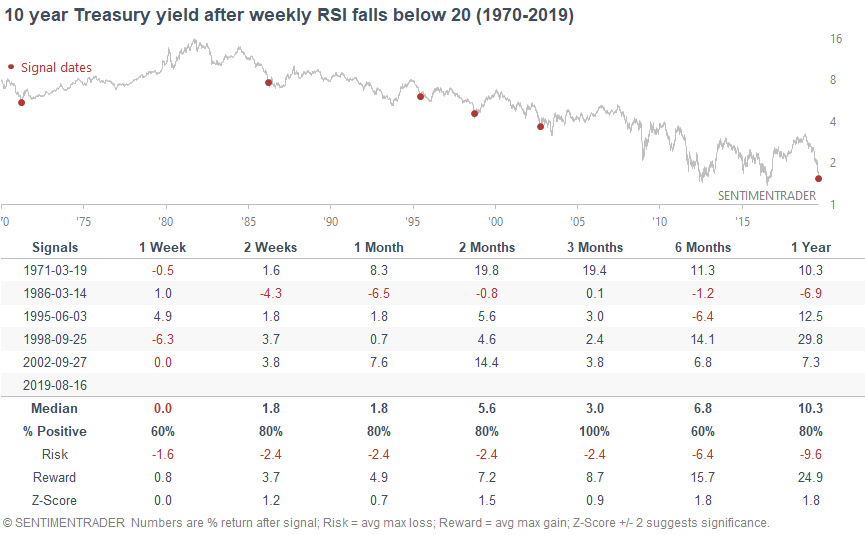
And the 10-year Treasury yield’s RSI fell below 20 on a weekly basis, something that’s happened 5 other times since 1970. Each time, stocks rose going forward, with an average gain of more than 22% in the S&P 500 a year later. Yields also rose.

DATA &
TECHnologies
IndicatorEdge
‍
BackTestEdge
‍
Other Tools
‍
DataEdge API
RESEARCH
reports
Research Solution
‍
Reports Library
‍
actionable
Strategies
Trading Strategies
‍
Smart Stock Scanner
‍
FREE
RESOUrCES
Simple Backtest
Calculator
Simple Seasonality
Calculator
The Kelly Criterion
Calculator
Sentiment Geo Map
‍
Public Research Reports
‍
Free Webinar
COMPANY
‍
About
‍
Meet our Team
‍
In the News
‍
Testimonials
‍
Client Success Stories
Pricing
Bundle pricing
‍
Announcements
‍
FAQ
© 2024 Sundial Capital Research Inc. All rights reserved.
Setsail Marketing
TermsPrivacyAffiliate Program
Risk Disclosure: Futures and forex trading contains substantial risk and is not for every investor. An investor could potentially lose all or more than the initial investment. Risk capital is money that can be lost without jeopardizing ones’ financial security or life style. Only risk capital should be used for trading and only those with sufficient risk capital should consider trading. Past performance is not necessarily indicative of future results.

Hypothetical Performance Disclosure: Hypothetical performance results have many inherent limitations, some of which are described below. No representation is being made that any account will or is likely to achieve profits or losses similar to those shown; in fact, there are frequently sharp differences between hypothetical performance results and the actual results subsequently achieved by any particular trading program. One of the limitations of hypothetical performance results is that they are generally prepared with the benefit of hindsight. In addition, hypothetical trading does not involve financial risk, and no hypothetical trading record can completely account for the impact of financial risk of actual trading. for example, the ability to withstand losses or to adhere to a particular trading program in spite of trading losses are material points which can also adversely affect actual trading results. There are numerous other factors related to the markets in general or to the implementation of any specific trading program which cannot be fully accounted for in the preparation of hypothetical performance results and all which can adversely affect trading results.

Testimonial Disclosure: Testimonials appearing on this website may not be representative of other clients or customers and is not a guarantee of future performance or success.