Data &
Technology
Research
Reports
Report Solutions
Reports Library
Actionable
Strategies
Free
Resources
Simple Backtest Calculator
Simple Seasonality Calculator
The Kelly Criterion Calculator
Sentiment Geo Map
Public Research Reports
Free Webinar
Pricing
Company
About
Meet Our Team
In the News
Testimonials
Client Success Stories
Contact
Log inLoginSign up
< BACK TO ALL REPORTS

Stocks have enjoyed a historic rally, and volatility remains high

Jason Goepfert
2020-07-08
Over the past 3 months, the S&P 500 has enjoyed a historic rally. Even so, options traders are still pricing in a relatively high amount of volatility. Using a synthetic VIX back to 1962, we can see that big rallies accompanied by high volatility had a consistent tendency to lead to even-higher prices over the medium- to long-term.

Stocks have enjoyed a historic rally over the last quarter, and yet options traders still seem relatively nervous.

As noted by Bloomberg, the S&P 500 has rallied strongly over several months, but the VIX "fear gauge" is higher than it typically would be given such a large rise in prices.

"Typically when stocks rise, the VIX falls as traders look forward to less turbulence ahead, and vice versa. Yet the likes of Goldman Sachs Group Inc. consider the gap between the gauge and S&P 500 returns one of the largest on record, thanks in part to the dizzying speed of the cash-equity rally."

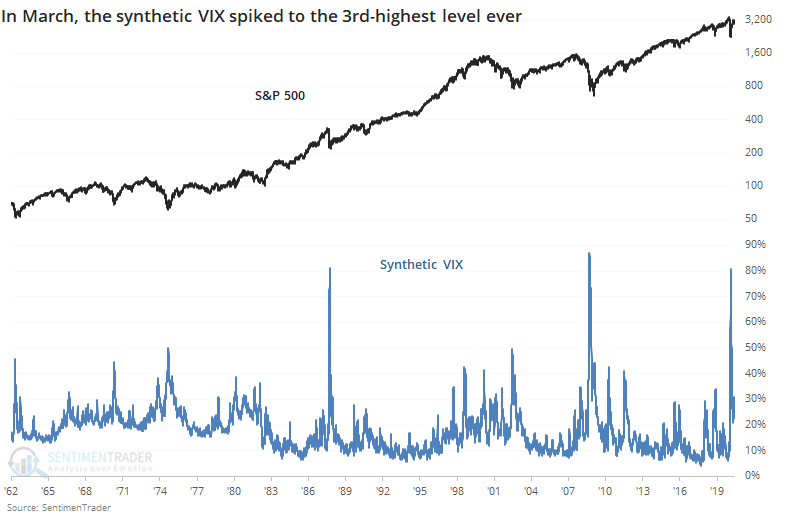
If we use the calculation for a synthetic VIX that we've used in the past, then we can see that we're still coming down from a historic spike, the 3rd-highest since 1962.

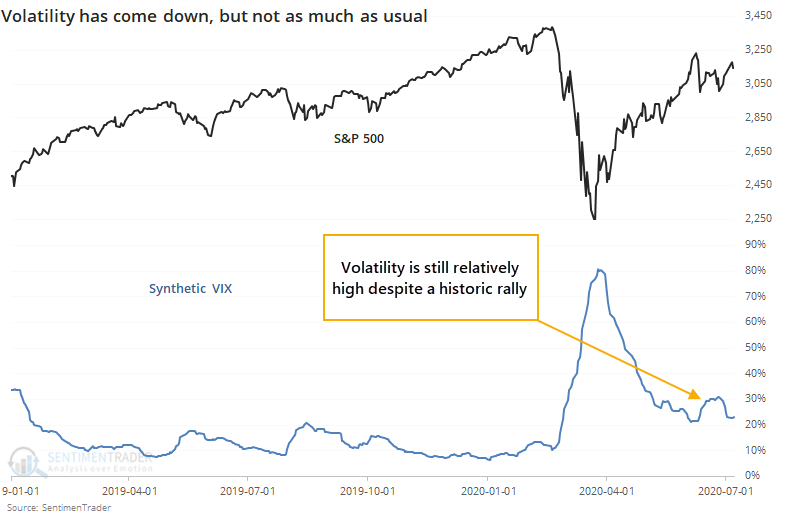
In recent months, stocks have rallied hard, and the synthetic VIX has declined significantly but still remains well above 20%.

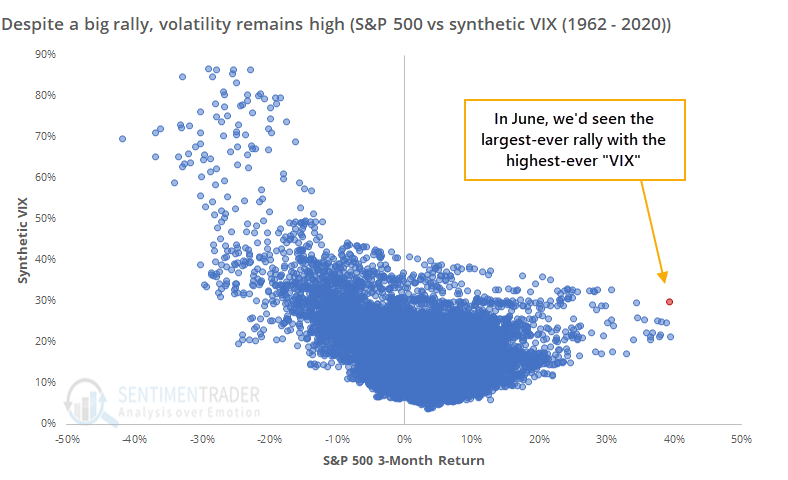
When we plot the S&P's 3-month return against the level of the synthetic VIX, then we can see the outliers (especially in June), confirming the note by Goldman Sachs.

The biggest question, as always, is "so what?" Let's check to see if this has any bearing on future returns.

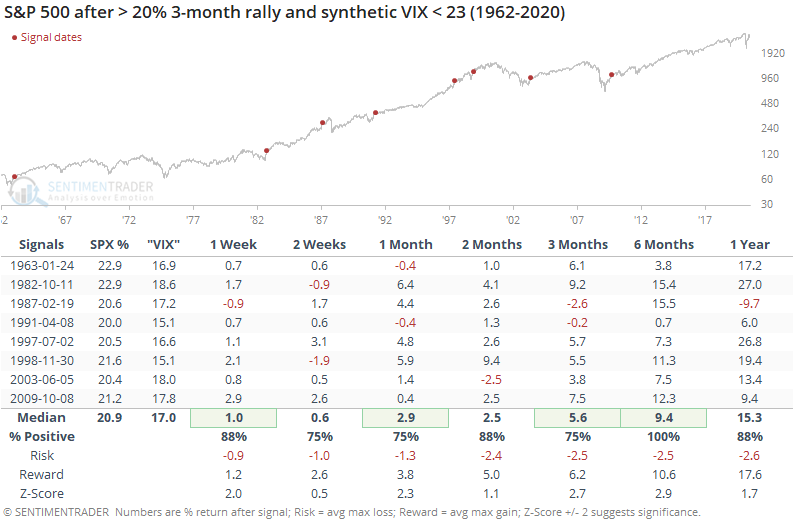
The table below shows every date since 1962 when the S&P 500 rallied at least 20% over a 3-month period, and yet the synthetic VIX remained above 23%.

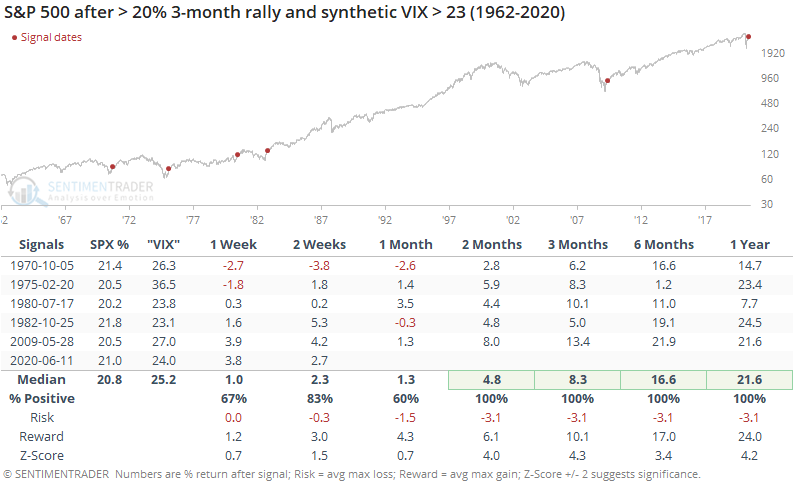
This triggered nearly a month ago and remains in effect, even as the S&P's rate of growth has slowed. The prior signals did not show that it was a worry that volatility remained elevated even during a major rally.

From two months and beyond, the S&P continued its rally all 5 times, enjoying a heavily skewed risk/reward ratio. Every one of them triggered after major corrections when volatility spiked so much that it was still high months after stocks rallied strongly.

Now, let's check the other scenario when stocks rallied hard but the synthetic VIX fell to a lower level.

This wasn't a major worry, either. Shorter-term returns were better than when the synthetic VIX stayed high, but longer-term returns were lower.

The biggest takeaways are that:

  1. Extremely high levels of volatility like we saw in March almost universally lead to higher 6-12 month prices in stocks
  2. Very large 3-month rallies in stocks tend to lead to even-higher prices over the medium- to long-term
  3. Elevated volatility in spite of a large rally in stocks has not been a reason for worry

Sorry, you don't have access to this report

Upgrade your subscription plan to get access
Go to Dasboard
DATA &
TECHnologies
IndicatorEdge
‍
BackTestEdge
‍
Other Tools
‍
DataEdge API
RESEARCH
reports
Research Solution
‍
Reports Library
‍
actionable
Strategies
Trading Strategies
‍
Smart Stock Scanner
‍
FREE
RESOUrCES
Simple Backtest
Calculator
Simple Seasonality
Calculator
The Kelly Criterion
Calculator
Sentiment Geo Map
‍
Public Research Reports
‍
Free Webinar
COMPANY
‍
About
‍
Meet our Team
‍
In the News
‍
Testimonials
‍
Client Success Stories
Pricing
Bundle pricing
‍
Announcements
‍
FAQ
© 2024 Sundial Capital Research Inc. All rights reserved.
Setsail Marketing
TermsPrivacyAffiliate Program
Risk Disclosure: Futures and forex trading contains substantial risk and is not for every investor. An investor could potentially lose all or more than the initial investment. Risk capital is money that can be lost without jeopardizing ones’ financial security or life style. Only risk capital should be used for trading and only those with sufficient risk capital should consider trading. Past performance is not necessarily indicative of future results.

Hypothetical Performance Disclosure: Hypothetical performance results have many inherent limitations, some of which are described below. No representation is being made that any account will or is likely to achieve profits or losses similar to those shown; in fact, there are frequently sharp differences between hypothetical performance results and the actual results subsequently achieved by any particular trading program. One of the limitations of hypothetical performance results is that they are generally prepared with the benefit of hindsight. In addition, hypothetical trading does not involve financial risk, and no hypothetical trading record can completely account for the impact of financial risk of actual trading. for example, the ability to withstand losses or to adhere to a particular trading program in spite of trading losses are material points which can also adversely affect actual trading results. There are numerous other factors related to the markets in general or to the implementation of any specific trading program which cannot be fully accounted for in the preparation of hypothetical performance results and all which can adversely affect trading results.

Testimonial Disclosure: Testimonials appearing on this website may not be representative of other clients or customers and is not a guarantee of future performance or success.