Data &
Technology
Research
Reports
Report Solutions
Reports Library
Actionable
Strategies
Free
Resources
Simple Backtest Calculator
Simple Seasonality Calculator
The Kelly Criterion Calculator
Sentiment Geo Map
Public Research Reports
Free Webinar
Pricing
Company
About
Meet Our Team
In the News
Testimonials
Client Success Stories
Contact
Log inLoginSign up
< BACK TO ALL REPORTS

Stocks Gap On NFP Miss And Sector Extremes

Jason Goepfert
2018-04-06
null

Below are some observations that have popped up in between reports. Some of these deserve more fleshed-out analysis, others are simply random observations as I cruise through the site and news feeds to get a handle on potential opportunities.

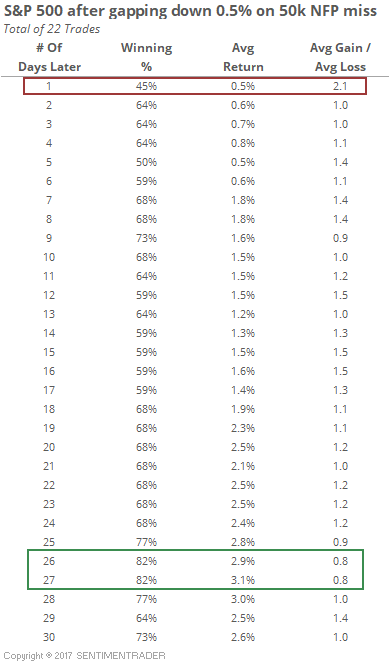
As we head into the final session of the week, futures remain lower after a miss in the Nonfarm Payroll report. That has had a slight tendency to lead to more very short-term weakness, but didn't have much impact beyond that. It's impossible to pin the pre-market losses on the NFP report, though, since losses were heavier overnight in response to the latest tariff headlines.

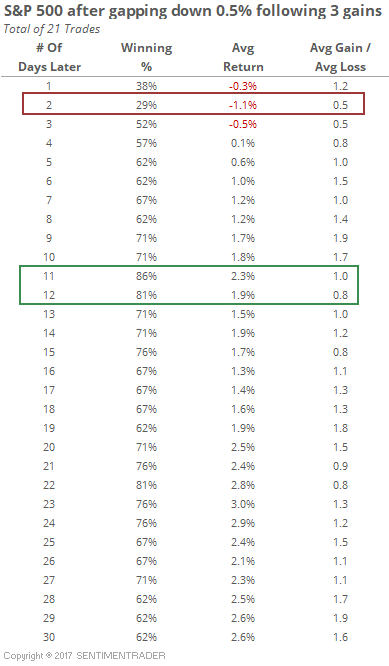
SPY is on track to gap down more than -0.5% following 3 straight days of gains of more than +0.5%. That has led to mostly lower prices in the very short-term, but by a couple of weeks later, almost all were higher.

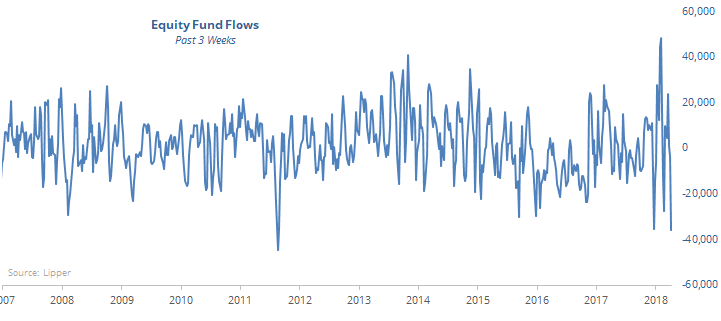
According to Lipper, investors pulled nearly $12 billion out of equity funds this week. They have now yanked a total of $35.6 billion from equity funds over the past 3 weeks, the 2nd-most in 15 years. The only 3-week period with a larger outflow ended in mid-August 2011.

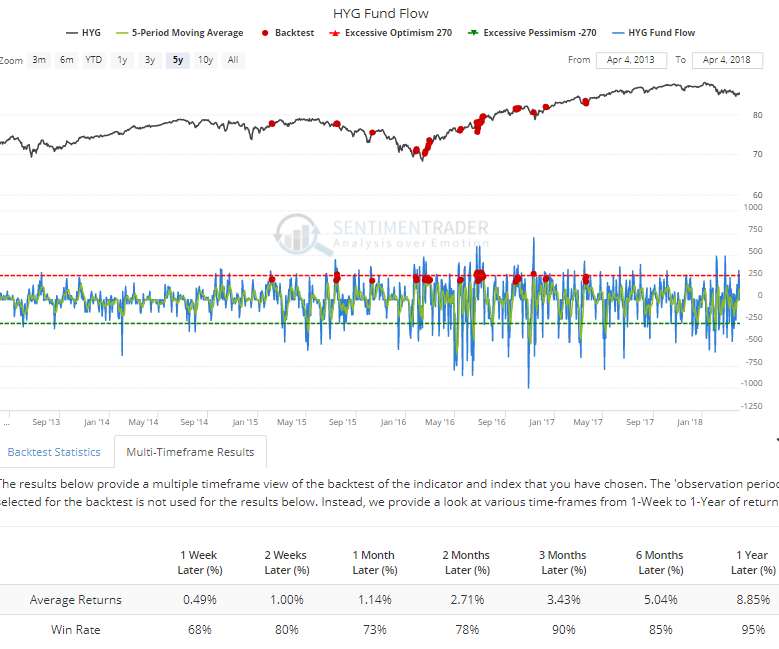
Fund investors are moving back into the high-yield ETFs, with more than $200 million flowing into HYG over the past week. Fund flows can be a difficult area to analyze and need to be done on a case-by-case basis. But when so much has started to flow back into the fund in recent years, it has led to more gains more often than not.

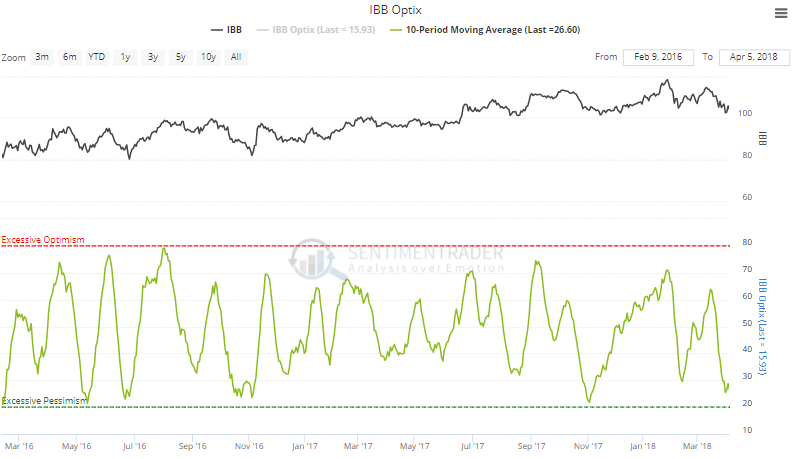
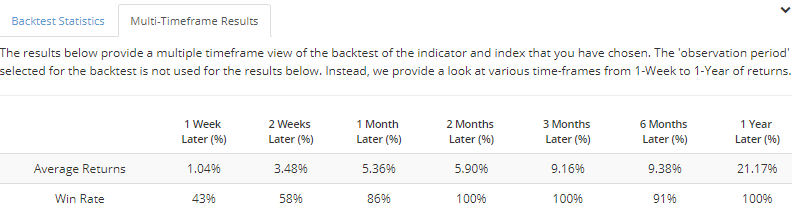
Biotech is the most-hated sector, with the 10-day Optimism Index on IBB falling below 30. In the past two years, that has preceded good medium-term returns.


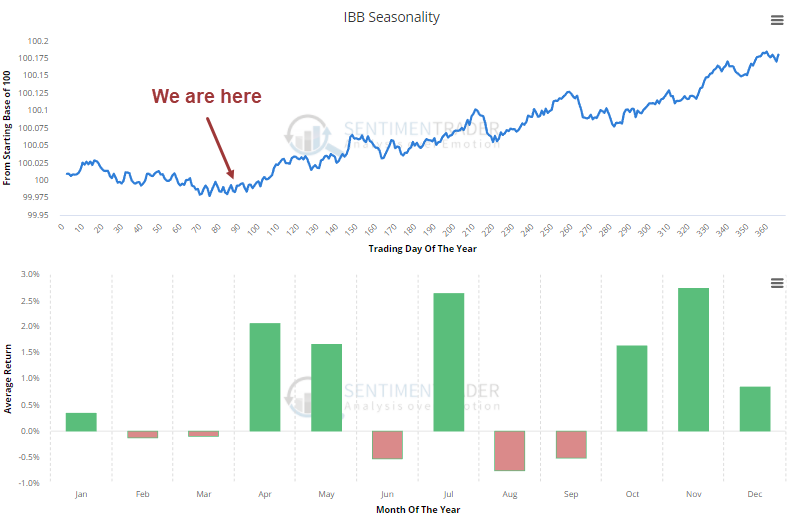
It's also worth noting that it's now entering one of its best times of the year, for those who put any weight on seasonal tendencies in stocks (I don't give it much weight at all).

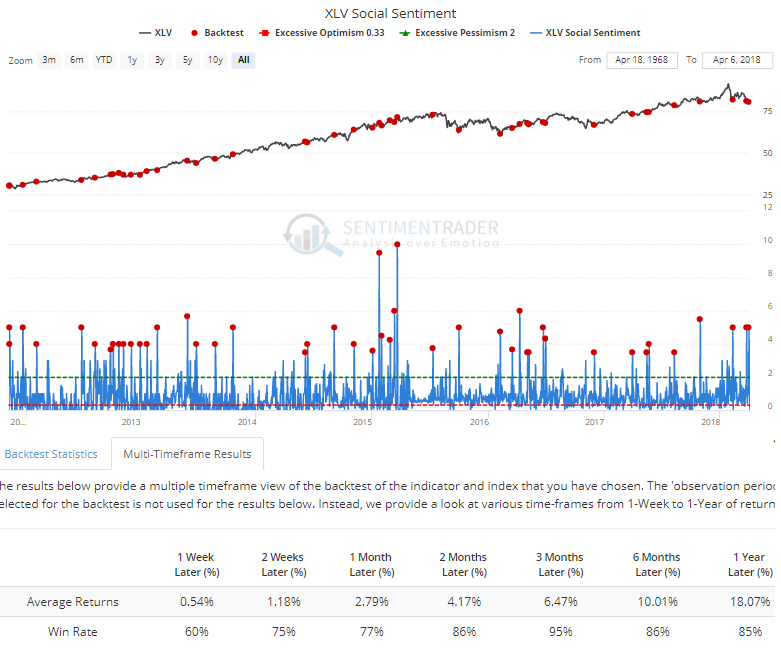
Twitter users have become the most pessimistic on XLV, the health care ETF, with more than 4 times as many bearish messages as bullish ones.

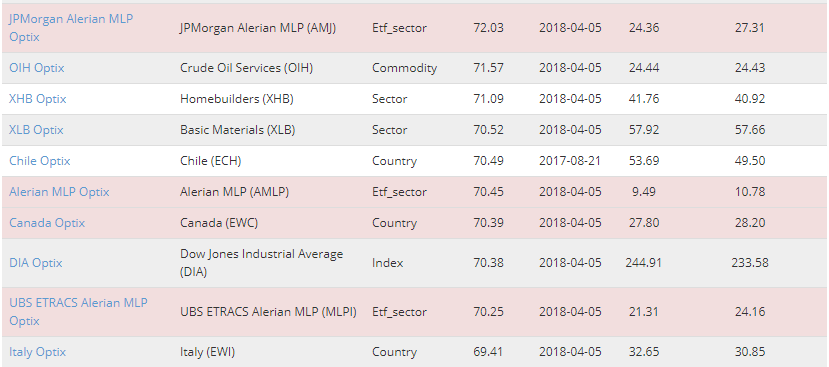
Our Sentiment & Trend screen is showing a few funds that have high optimism but are trading below their 200-day moving averages. Three of them are MLPs. Like always, a market that's able to continue to rally in the face of resistance like this is sending a positive longer-term signal...but they need to prove themselves first.

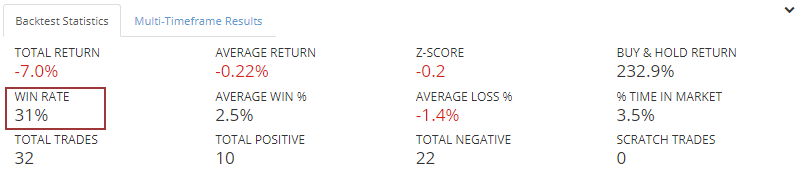
Every one of the stocks in the Basic Materials sector is above their 10-day moving average. The XLB fund *just barely* is above its 200-day average.

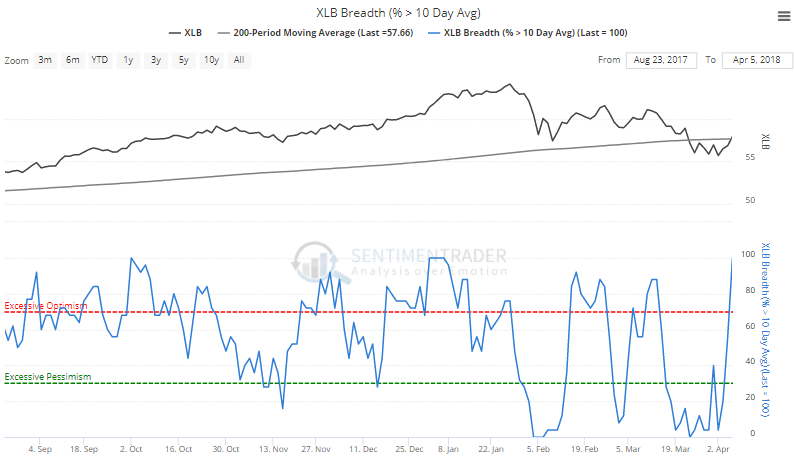
If we fudge a bit and assume it's below its average, the fund has struggled to hold onto its gains over the next week, rallying over the next week only 31% of the time.

Sorry, you don't have access to this report

Upgrade your subscription plan to get access
Go to Dasboard
DATA &
TECHnologies
IndicatorEdge
‍
BackTestEdge
‍
Other Tools
‍
DataEdge API
RESEARCH
reports
Research Solution
‍
Reports Library
‍
actionable
Strategies
Trading Strategies
‍
Smart Stock Scanner
‍
FREE
RESOUrCES
Simple Backtest
Calculator
Simple Seasonality
Calculator
The Kelly Criterion
Calculator
Sentiment Geo Map
‍
Public Research Reports
‍
Free Webinar
COMPANY
‍
About
‍
Meet our Team
‍
In the News
‍
Testimonials
‍
Client Success Stories
Pricing
Bundle pricing
‍
Announcements
‍
FAQ
© 2024 Sundial Capital Research Inc. All rights reserved.
Setsail Marketing
TermsPrivacyAffiliate Program
Risk Disclosure: Futures and forex trading contains substantial risk and is not for every investor. An investor could potentially lose all or more than the initial investment. Risk capital is money that can be lost without jeopardizing ones’ financial security or life style. Only risk capital should be used for trading and only those with sufficient risk capital should consider trading. Past performance is not necessarily indicative of future results.

Hypothetical Performance Disclosure: Hypothetical performance results have many inherent limitations, some of which are described below. No representation is being made that any account will or is likely to achieve profits or losses similar to those shown; in fact, there are frequently sharp differences between hypothetical performance results and the actual results subsequently achieved by any particular trading program. One of the limitations of hypothetical performance results is that they are generally prepared with the benefit of hindsight. In addition, hypothetical trading does not involve financial risk, and no hypothetical trading record can completely account for the impact of financial risk of actual trading. for example, the ability to withstand losses or to adhere to a particular trading program in spite of trading losses are material points which can also adversely affect actual trading results. There are numerous other factors related to the markets in general or to the implementation of any specific trading program which cannot be fully accounted for in the preparation of hypothetical performance results and all which can adversely affect trading results.

Testimonial Disclosure: Testimonials appearing on this website may not be representative of other clients or customers and is not a guarantee of future performance or success.