
Stocks can't keep up...and a dirty little secret

Running behind
As the S&P 500 recently hit record highs, fewer of its stocks have kept up. Over the past three months, fewer than 40% of them managed to show a return that was higher than the index itself. In the past 15 years, there was only one date - and not a good one - when so few stocks beat the S&P when the index was hitting a 52-week high.
There has been a big cluster of these days lately. Below, we can see how many days in the past 3 months showed fewer than 50% of stocks beating the S&P when it closed at a 52-week high.
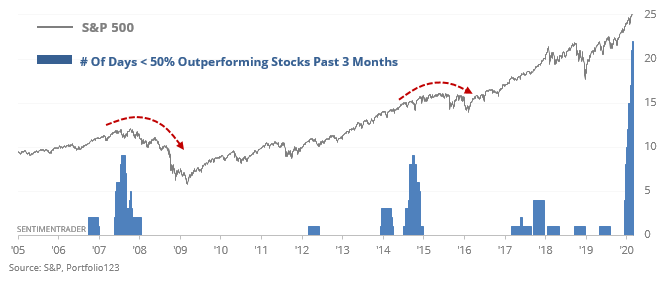
The others did not work out well for late buyers.
A Dirty Secret
If you don't work in the finance/investment industry, we're going to let you in on a little secret. A secret that all financial marketers know.
At any given point in time, there are valid reasons to be both bullish AND bearish. So, the trick to being a successful financial marketer or newsletter writer (for a while, anyway) is:
- Pick one side of the market. Do not flip flop or show both sides.
- ONLY present the arguments that support your bullish/bearish stance. Hide any evidence that doesn't support your narrative.
- Show only charts with cherry-picked examples, not tables that objectively show every occurrence.
- Hype things up. If something is a little bearish, show your readers how it's actually crazy bearish.
- Let everyone know you're here to just "pay it forward and help others out."
- If your market outlook has been wrong for a while, don't worry. Eventually you'll be right! Then when you are, tell every what a genius you are. Unfortunately, this is the most effective way to increase sales.
We DO NOT advocate any of this. It's dishonest, and it doesn't help investors.
Here, we try hard to be balanced, present market developments supported by actual evidence, then weigh those to see if there is a solid conclusion. Sometimes there is; often there is not. That drives some people nuts, who just want to be told what to do or confirm their existing bias. We are not for them.
Here's an example.
Right now, the 2 most important factors for the U.S. stock market are momentum and sentiment.
- Momentum is a mixed bag right now - depending on how you look at it, could be bearish or not-so-bearish
- Sentiment is bearish (meaning it's too optimistic, which from a contrary point of view usually leads to below-average returns)
Among the most egregious examples of momentum lies in tech. The NASDAQ Composite:S&P 500 ratio's 14 week RSI is extremely high. Must be crazy bearish, right?
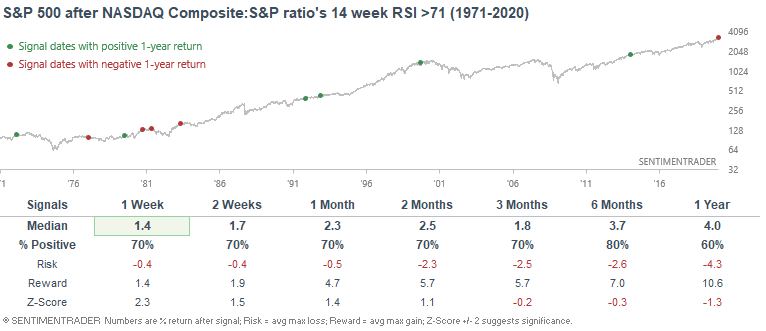
Not quite.
But here's an example of hype (i.e. picking out the 1 piece of crazy bearish "evidence" and ignoring the less extreme evidence):
"Tech's momentum is extreme. NASDAQ 100's 20 day moving average has gone up 88 days in a row, THE MOST EXTREME IN HISTORY. Similar streaks ended with SHARP corrections over the next month."
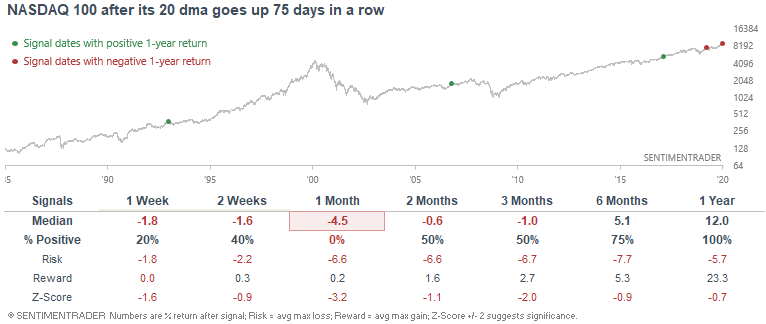
Sure, the NDX was down every time over the next month. But the sample size was 4.
If you look at the data, the most reasonable narrative is:
The market is overextended based on sentiment and momentum, hence the probability of a pullback/correction is higher than normal.
Probability is not certainty. Nobody consistently and accurately knows "when." All we can estimate is risk vs. reward.
This is an abridged version of our recent reports and notes. For immediate access with no obligation, sign up for a 30-day free trial now.
We also looked at:
- The Nasdaq / S&P ratio is overbought
- Tech is nearing a record stretch of up weeks
- Our Optimism Index is nearing a record high over the past 100 days
- Investor and advisors have been extremely optimistic
- Our de-trended put/call ratio is stretched
- There have been few pessimistic indicators for months
- What happens after the U.S. dollar has great starts to a year