Data &
Technology
Research
Reports
Report Solutions
Reports Library
Actionable
Strategies
Free
Resources
Simple Backtest Calculator
Simple Seasonality Calculator
The Kelly Criterion Calculator
Sentiment Geo Map
Public Research Reports
Free Webinar
Pricing
Company
About
Meet Our Team
In the News
Testimonials
Client Success Stories
Contact
Log inLoginSign up
< BACK TO ALL REPORTS

Stocks are worth more than the whole economy

Jason Goepfert
2020-08-12
Global stock market capitalization is higher than global GDP for one of the few times ever. Even just the valuation of U.S. stocks is nearing half of global output, a level seen only twice before in the past 60 years. The other two preceded many years of U.S. underperformance relative to the rest of the world's markets.

Stocks have disconnected from the economy, and that's not news. The divergence has been going on for months, with a relentless rally in stocks juxtaposed against terrible economic numbers and even more horrendous anecdotes about job losses, business closures, and bankruptcies.

While stocks generally follow the economy, the two are not linked to any tight degree. They can decouple for months at a time, as investors are much more forward-looking than economic reports. Still, this has been a standout year when it comes to trying to use one to forecast the other.

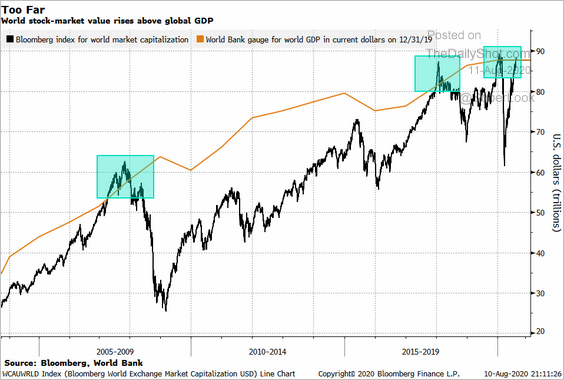
As Bloomberg notes, the capitalization of equities across the world has surpassed global gross domestic product.

"The market value of the world’s equities has risen above the dollar value of the global economy, which some investors say is a sign of overheated markets. Total stock-market capitalization reached $87.83 trillion on Sunday, compared with the 2019 gross domestic product of all countries at $87.75 trillion."

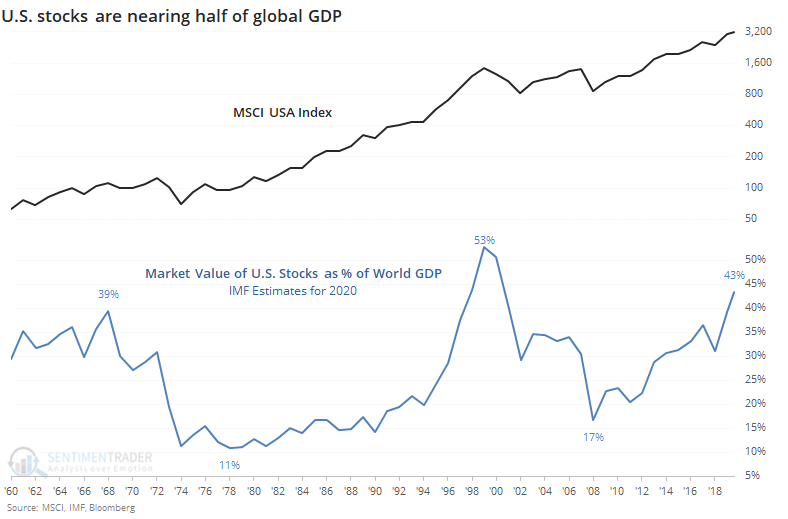
With the stunning rise in big American tech stocks, the U.S. portion of this global equity market capitalization is nearing all-time highs. While there isn't necessarily a connection between stock values and economic output, it is a way to estimate sentiment and valuations.

While stocks' value as a share of U.S. GDP has taken a hit, the total market cap of all U.S. stocks relative to the latest IMF estimate for global GDP in 2020 is now above 40% for only the 2nd time in 60 years.

If stocks continue their gains into year-end and GDP craters more than feared, then there's a chance we could eclipse the 1999 peak, but that would be tough to do. Even so, we've already eclipsed the other peak from 1968.

Whatever the theories behind the recent run of American exceptionalism (in stock valuations, anyway), by the time it nears 40% of global GDP, the run in U.S. stocks versus the rest of the world has been near its end, at least judging by the tiny sample size we have.

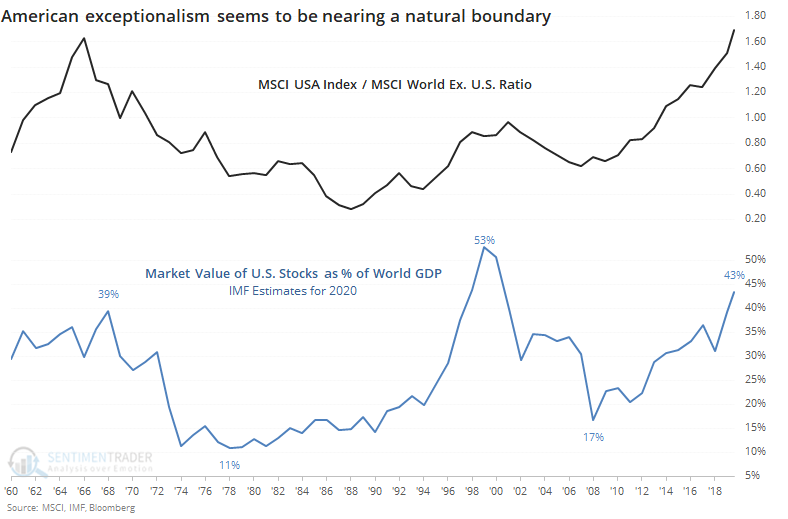
In the late 1960s, U.S. stocks had already started to underperform indexes in other parts of the world by the time this ratio peaked. In 1999, there was a bit more room to go before rolling over. Both times, equity values in the U.S. greatly trailed those outside the U.S. over the next five years at least.

It's hard for some investors to imagine what could knock U.S. stocks off their pedestals, but history is clear that something, somewhere, for some reason, will do it. Relying on the top 5 stocks to continue to carry the rest of the market is getting increasingly risky.

Sorry, you don't have access to this report

Upgrade your subscription plan to get access
Go to Dasboard
DATA &
TECHnologies
IndicatorEdge
‍
BackTestEdge
‍
Other Tools
‍
DataEdge API
RESEARCH
reports
Research Solution
‍
Reports Library
‍
actionable
Strategies
Trading Strategies
‍
Smart Stock Scanner
‍
FREE
RESOUrCES
Simple Backtest
Calculator
Simple Seasonality
Calculator
The Kelly Criterion
Calculator
Sentiment Geo Map
‍
Public Research Reports
‍
Free Webinar
COMPANY
‍
About
‍
Meet our Team
‍
In the News
‍
Testimonials
‍
Client Success Stories
Pricing
Bundle pricing
‍
Announcements
‍
FAQ
© 2024 Sundial Capital Research Inc. All rights reserved.
Setsail Marketing
TermsPrivacyAffiliate Program
Risk Disclosure: Futures and forex trading contains substantial risk and is not for every investor. An investor could potentially lose all or more than the initial investment. Risk capital is money that can be lost without jeopardizing ones’ financial security or life style. Only risk capital should be used for trading and only those with sufficient risk capital should consider trading. Past performance is not necessarily indicative of future results.

Hypothetical Performance Disclosure: Hypothetical performance results have many inherent limitations, some of which are described below. No representation is being made that any account will or is likely to achieve profits or losses similar to those shown; in fact, there are frequently sharp differences between hypothetical performance results and the actual results subsequently achieved by any particular trading program. One of the limitations of hypothetical performance results is that they are generally prepared with the benefit of hindsight. In addition, hypothetical trading does not involve financial risk, and no hypothetical trading record can completely account for the impact of financial risk of actual trading. for example, the ability to withstand losses or to adhere to a particular trading program in spite of trading losses are material points which can also adversely affect actual trading results. There are numerous other factors related to the markets in general or to the implementation of any specific trading program which cannot be fully accounted for in the preparation of hypothetical performance results and all which can adversely affect trading results.

Testimonial Disclosure: Testimonials appearing on this website may not be representative of other clients or customers and is not a guarantee of future performance or success.