Data &
Technology
Research
Reports
Report Solutions
Reports Library
Actionable
Strategies
Free
Resources
Simple Backtest Calculator
Simple Seasonality Calculator
The Kelly Criterion Calculator
Sentiment Geo Map
Public Research Reports
Free Webinar
Pricing
Company
About
Meet Our Team
In the News
Testimonials
Client Success Stories
Contact
Log inLoginSign up
< BACK TO ALL REPORTS

Stocks are seeing high optimism during an unhealthy environment

Jason Goepfert
2020-07-28
Fewer than 60% of countries (and sectors, industries, and stocks) are above their 200-day moving averages, yet Dumb Money Confidence is extremely high.

Investors are extremely optimistic at the moment, despite an unhealthy market environment.

There are a number of ways to define these. Simply looking for prices above/below the 200-day moving average works just about as well as complex trend models, and it's a good, clear-defined alternative. Combine that with a simple view of whether prices are making higher highs and higher lows, lower highs and lower lows, or both and you can get an excellent sense for whether bulls or bears are in control. 

Another of our preferred methods is looking at participation - how many securities are in uptrends/downtrends.

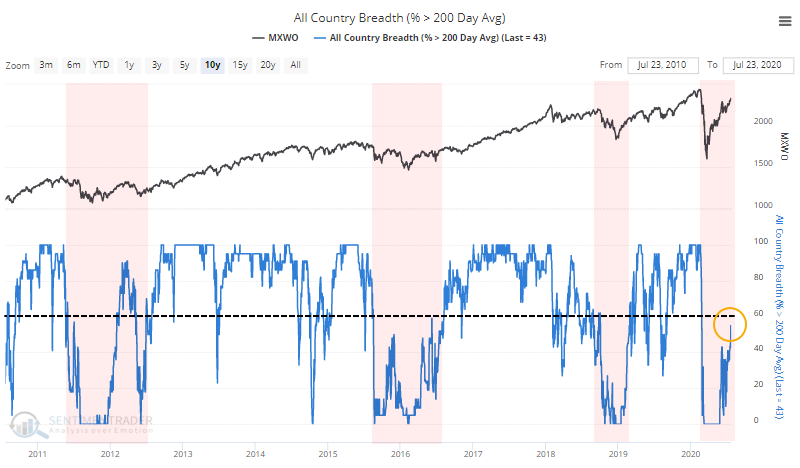
Healthy environments consistently see more than 60% of stocks, industries, sectors, and countries holding above their 200-day averages. Unhealthy environments consistently see fewer than 60% of these above their averages, and spikes above that level tend to get sold quickly.

That's where we are now. In addition to a large number of stocks trailing the S&P by double-digits, fewer than 60% have been able to hold above their 200-day averages. That's true among S&P 500 stocks, industries, sectors, and even global country indexes.

Percent of countries above 200 day moving average

We've often noted that during times of unhealthy market environments, when fewer than 60% of stocks can hold above their 200-day averages, that periods of high optimism tend to lead to below-average forward returns.

We're seeing that now, to a historic degree. Since we've been tracking this data, just over 20 years, there has never been a day when Dumb Money Confidence was at or above 80% while fewer than 60% of stocks in the S&P 500 were trading above their 200-day averages. Until now.


This is an abridged version of our recent reports and notes. For immediate access with no obligation, sign up for a 30-day free trial now.

We also looked at:

  • A more in-depth look at stocks, industries, and sectors trading above their long-term averages
  • Forward returns when unhealthy environments are coupled with high optimism (and the opposite scenario)
  • Global economic surprises and earnings revisions have jumped higher - what that's meant for U.S. and overseas markets
  • U.S. dollar sentiment has plunged, with its surprising impact on gold
  • Both gold and silver are technically overbought to a historic degree
DATA &
TECHnologies
IndicatorEdge
‍
BackTestEdge
‍
Other Tools
‍
DataEdge API
RESEARCH
reports
Research Solution
‍
Reports Library
‍
actionable
Strategies
Trading Strategies
‍
Smart Stock Scanner
‍
FREE
RESOUrCES
Simple Backtest
Calculator
Simple Seasonality
Calculator
The Kelly Criterion
Calculator
Sentiment Geo Map
‍
Public Research Reports
‍
Free Webinar
COMPANY
‍
About
‍
Meet our Team
‍
In the News
‍
Testimonials
‍
Client Success Stories
Pricing
Bundle pricing
‍
Announcements
‍
FAQ
© 2024 Sundial Capital Research Inc. All rights reserved.
Setsail Marketing
TermsPrivacyAffiliate Program
Risk Disclosure: Futures and forex trading contains substantial risk and is not for every investor. An investor could potentially lose all or more than the initial investment. Risk capital is money that can be lost without jeopardizing ones’ financial security or life style. Only risk capital should be used for trading and only those with sufficient risk capital should consider trading. Past performance is not necessarily indicative of future results.

Hypothetical Performance Disclosure: Hypothetical performance results have many inherent limitations, some of which are described below. No representation is being made that any account will or is likely to achieve profits or losses similar to those shown; in fact, there are frequently sharp differences between hypothetical performance results and the actual results subsequently achieved by any particular trading program. One of the limitations of hypothetical performance results is that they are generally prepared with the benefit of hindsight. In addition, hypothetical trading does not involve financial risk, and no hypothetical trading record can completely account for the impact of financial risk of actual trading. for example, the ability to withstand losses or to adhere to a particular trading program in spite of trading losses are material points which can also adversely affect actual trading results. There are numerous other factors related to the markets in general or to the implementation of any specific trading program which cannot be fully accounted for in the preparation of hypothetical performance results and all which can adversely affect trading results.

Testimonial Disclosure: Testimonials appearing on this website may not be representative of other clients or customers and is not a guarantee of future performance or success.