Data &
Technology
Research
Reports
Report Solutions
Reports Library
Actionable
Strategies
Free
Resources
Simple Backtest Calculator
Simple Seasonality Calculator
The Kelly Criterion Calculator
Sentiment Geo Map
Public Research Reports
Free Webinar
Pricing
Company
About
Meet Our Team
In the News
Testimonials
Client Success Stories
Contact
Log inLoginSign up
< BACK TO ALL REPORTS

Stocks are calming down after near-record volatility

Jason Goepfert
2020-08-10
After a near-record amount of volatility in March and April, stock swings have calmed down. The S&P 500's average true range over a 5-day span dropped to less than 1% for the first time in months. That hasn't been a reliable sign that calm conditions would necessarily last.

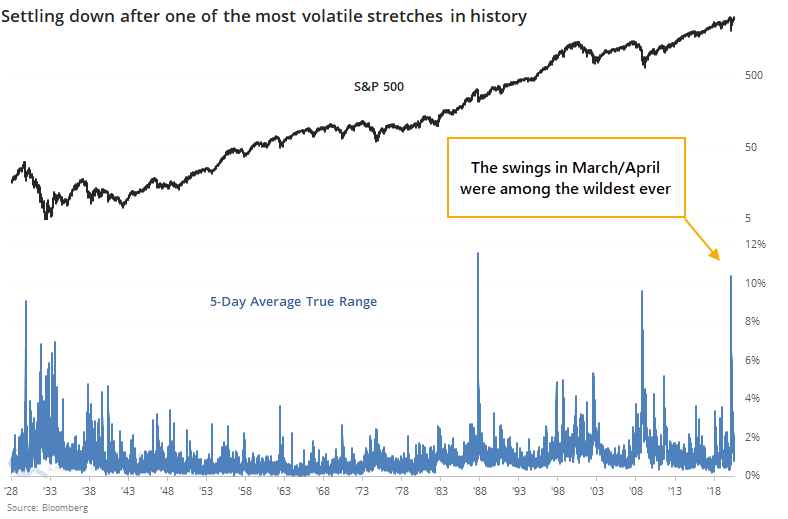
In March and April, we spent a lot of time looking at the historic volatility in indexes and stocks. On some measures, it was the most volatile stretch in history, with the others essentially showing a perfect record of higher prices over the next 6-12 months.

Since then, volatility has ebbed. As Troy showed in a premium note, the VIX has declined for 16 out of the past 20 weeks, a record stretch. The four other times it declined 15 out of 20 weeks, it jumped during the next 2-4 weeks.

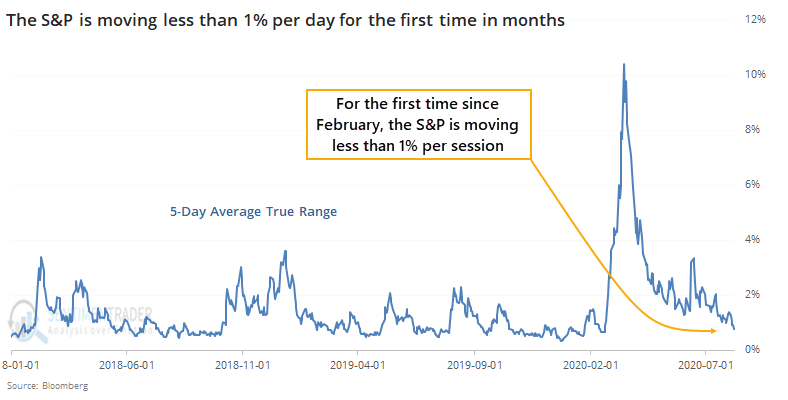
Over the past week, in particular, stocks have calmed down. The 5-day average true range for the S&P 500 dropped below 1% for the first time in months. The end of August is often the least volatile, with the lowest volume, out of the entire year (including holidays) but this is early.

Of course, this follows what had been one of the wildest periods ever.

Once the S&P's average true range cycles from above 4% to below 1%, theory suggests that investors have come to grips with whatever crisis was at the forefront at the time, ostensibly ushering in calmer conditions and higher prices.

Let's check.

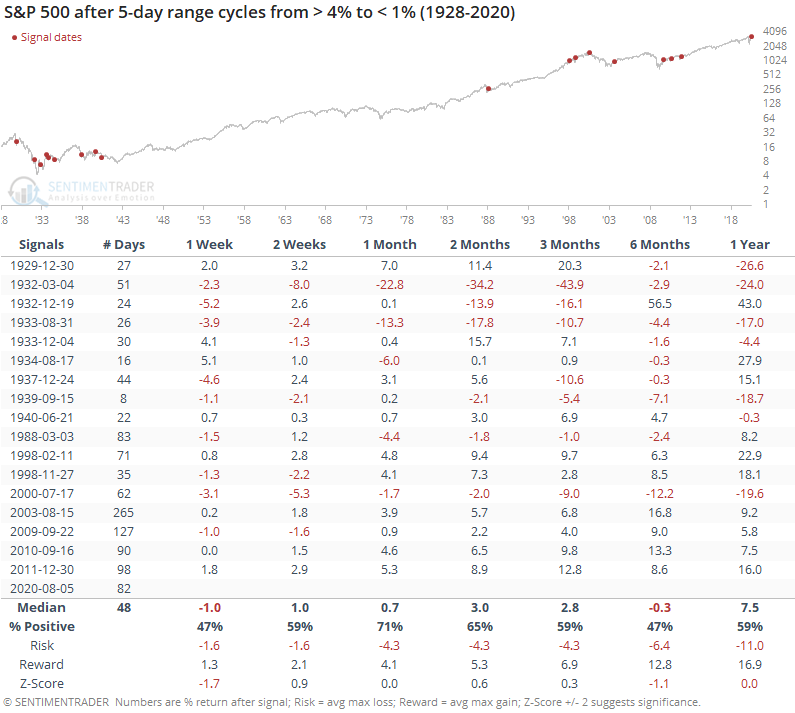
An argument could be made that this is the case, as the S&P rose most of the time, across most time frames. It was no slam dunk, however, and six months later it was down more often than up, with a poor average return.

The risk/reward skew across all time frames was poor as well, though much of that is due to the multiple signals in the 1930s. In recent decades, it has been more of a medium- to long-term positive, but with worse performance shorter-term.

Prior to the last 5 years or so, very narrow ranges, on light volume, as stocks neared previous highs was a decent suggestion that selling pressure was about to hit. Price and volume patterns have become less reliable in recent years, however, and we wouldn't place much weight on that.

There also isn't much evidence that this new regime of calm is necessarily a good sign for bulls - the best signals triggered coming out of major declines, which we have. And some of the worst came when stocks were near their highs, which we are. Seems like a wash.

Sorry, you don't have access to this report

Upgrade your subscription plan to get access
Go to Dasboard
DATA &
TECHnologies
IndicatorEdge
‍
BackTestEdge
‍
Other Tools
‍
DataEdge API
RESEARCH
reports
Research Solution
‍
Reports Library
‍
actionable
Strategies
Trading Strategies
‍
Smart Stock Scanner
‍
FREE
RESOUrCES
Simple Backtest
Calculator
Simple Seasonality
Calculator
The Kelly Criterion
Calculator
Sentiment Geo Map
‍
Public Research Reports
‍
Free Webinar
COMPANY
‍
About
‍
Meet our Team
‍
In the News
‍
Testimonials
‍
Client Success Stories
Pricing
Bundle pricing
‍
Announcements
‍
FAQ
© 2024 Sundial Capital Research Inc. All rights reserved.
Setsail Marketing
TermsPrivacyAffiliate Program
Risk Disclosure: Futures and forex trading contains substantial risk and is not for every investor. An investor could potentially lose all or more than the initial investment. Risk capital is money that can be lost without jeopardizing ones’ financial security or life style. Only risk capital should be used for trading and only those with sufficient risk capital should consider trading. Past performance is not necessarily indicative of future results.

Hypothetical Performance Disclosure: Hypothetical performance results have many inherent limitations, some of which are described below. No representation is being made that any account will or is likely to achieve profits or losses similar to those shown; in fact, there are frequently sharp differences between hypothetical performance results and the actual results subsequently achieved by any particular trading program. One of the limitations of hypothetical performance results is that they are generally prepared with the benefit of hindsight. In addition, hypothetical trading does not involve financial risk, and no hypothetical trading record can completely account for the impact of financial risk of actual trading. for example, the ability to withstand losses or to adhere to a particular trading program in spite of trading losses are material points which can also adversely affect actual trading results. There are numerous other factors related to the markets in general or to the implementation of any specific trading program which cannot be fully accounted for in the preparation of hypothetical performance results and all which can adversely affect trading results.

Testimonial Disclosure: Testimonials appearing on this website may not be representative of other clients or customers and is not a guarantee of future performance or success.