
Stochastic Momentum Signal Concept

In a note on Tuesday, I shared a trading signal that utilizes the 14-day slow stochastic indicator. As a reminder, the stochastic indicator compares the current closing price to a range of prices over a lookback period. One can find the slow and fast stochastic indicator in most charting applications with a standard-setting of 14 days.
Suppose you're interested in learning more about the stochastic indicator. In that case, a simple google search will provide plenty of material.
Today's note aims to share a concept that uses a derivative of the fast stochastic indicator to identify a hypothetical buy signal when a stock, ETF, or Commodity reverses from an oversold condition.
TECHNICAL INDICATOR
The Fast Stochastic indicator with an input length of 49 days is utilized to assess intermediate-term market conditions.
THE CONCEPT
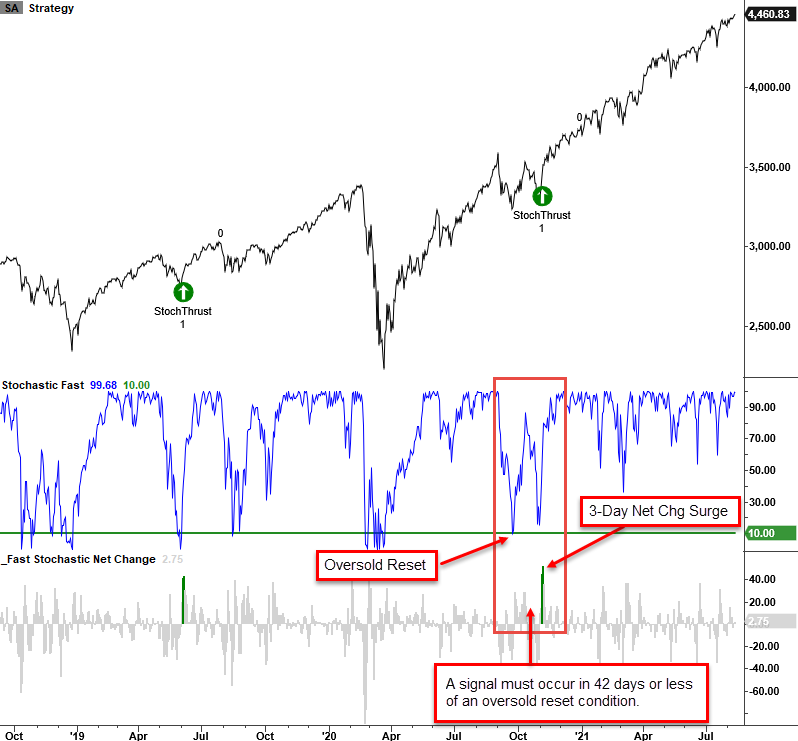
The fast stochastic net change signal identifies when the N-day net change in the fast stochastic surges above a user-defined level after an oversold condition. The model will issue an alert based upon the following conditions.
SIGNAL CRITERIA FOR THE S&P 500 INDEX
1.) If the fast stochastic indicator crosses below the oversold reset input value of 10%, the reset condition is active. The reset condition must occur for a new signal to trigger.
2.) If the fast stochastic 3-day net change crosses above the overbought threshold level of 42%, and the number of days since the fast stochastic was last below the oversold reset level of 10% is less than or equal to 42 days, then buy.
Why do I use a window period for the signal? Because I want to ensure that a signal is associated with a current oversold condition for the underlying security.
CURRENT DAY CHART
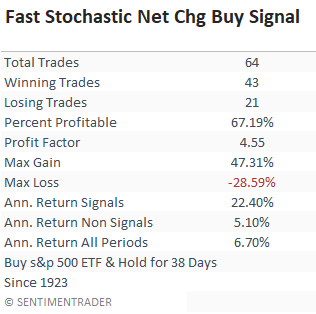
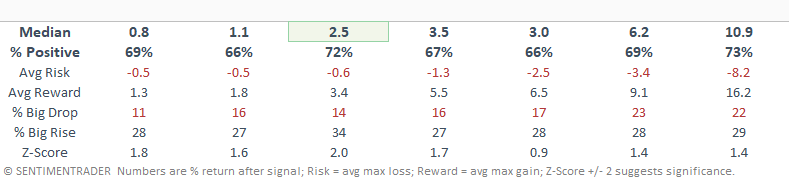
TRADING STATISTICS
The trading statistics in the table below reflect the optimal days-in-trade holding period of 38 days. When I run optimizations for trading signals, I cap the max number of days at 42.
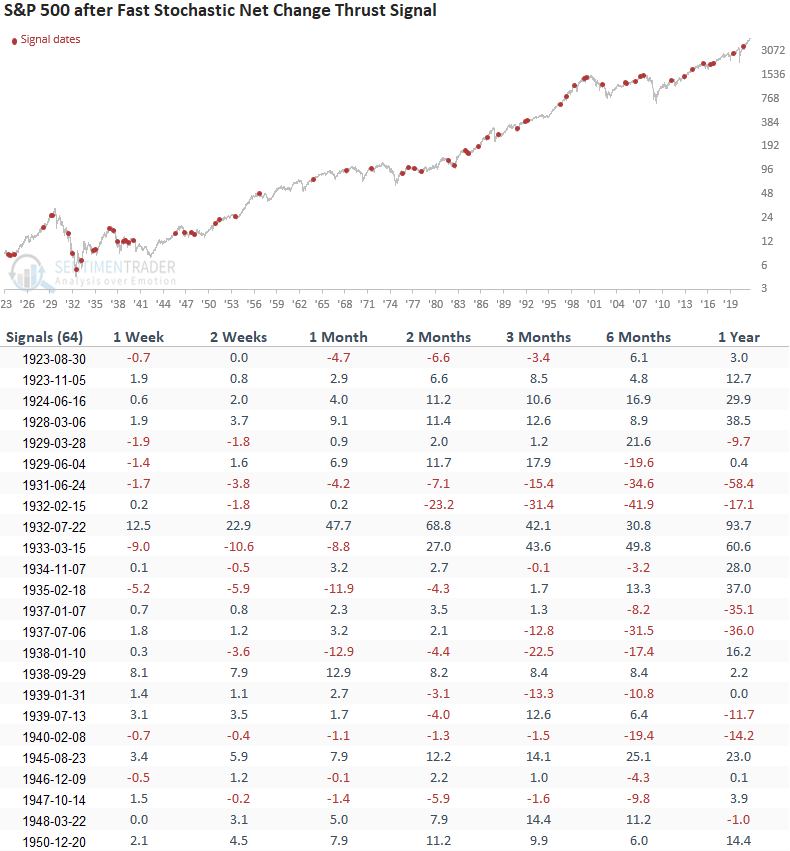
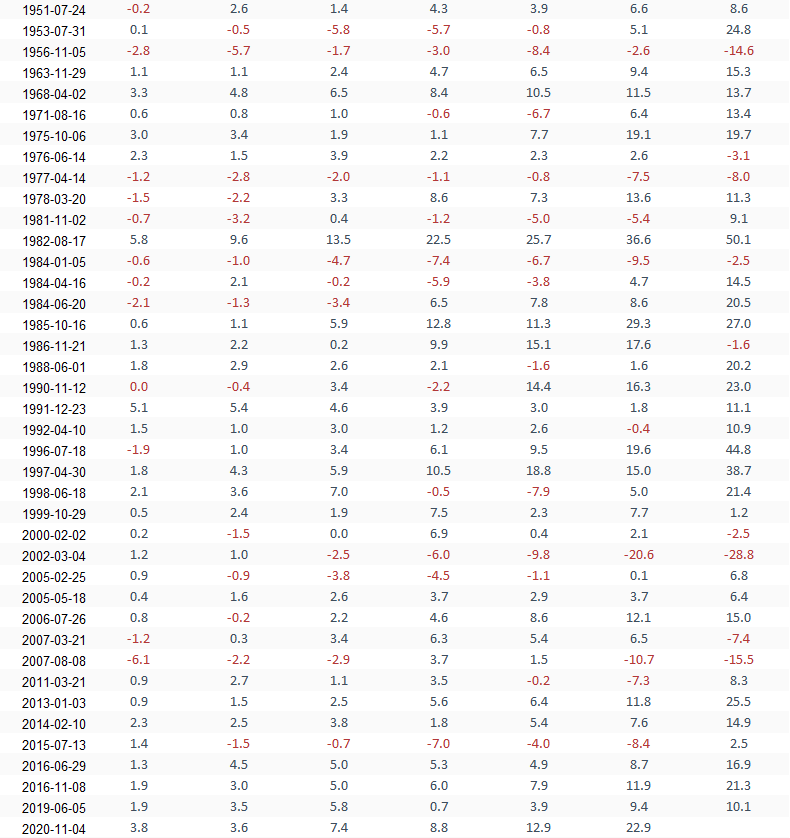
HOW THE SIGNALS PERFORMED
Performance looks good, especially in the first two months. Looking at more recent history, the 1-week timeframe since 1985 is excellent, with a profitability percentage of 88%.
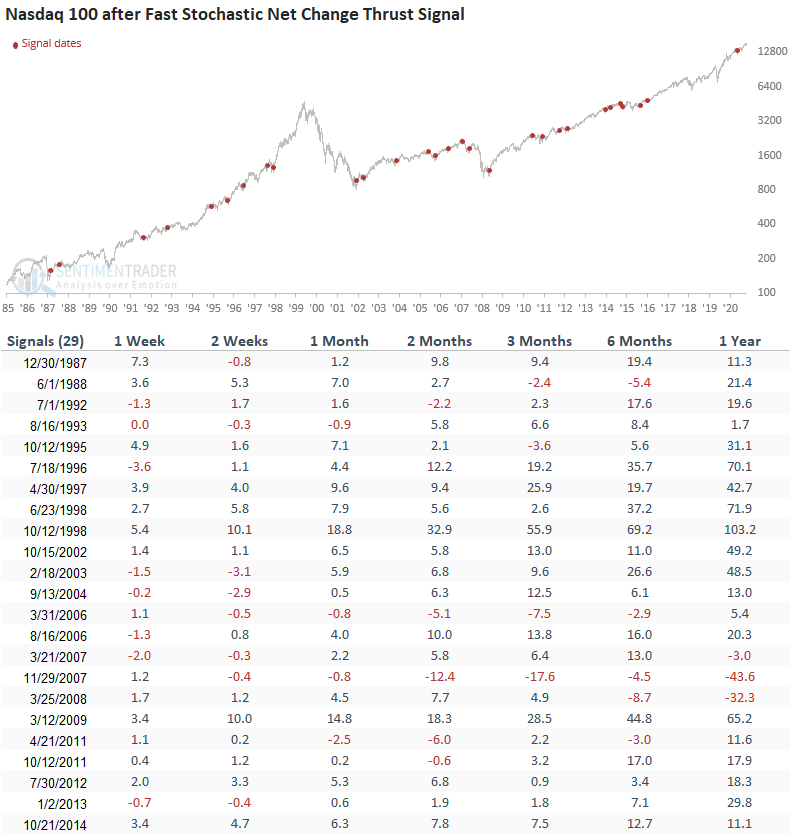
If you wondered how the signal performs on an actively traded index like the Nasdaq 100 or QQQ ETF, let's take a look
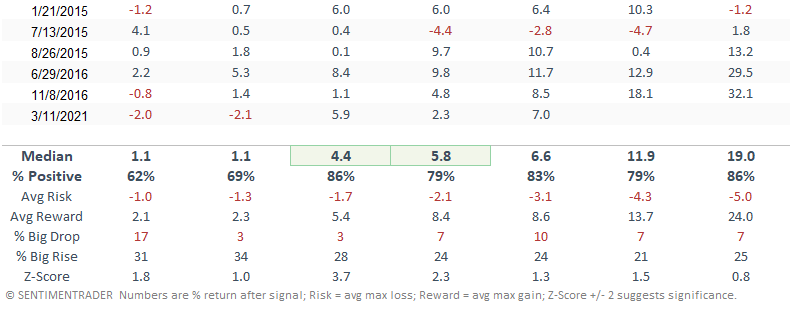
HOW THE SIGNALS PERFORMED - NASDAQ 100
Performance looks solid across all timeframes, especially in the 1-2 month window.
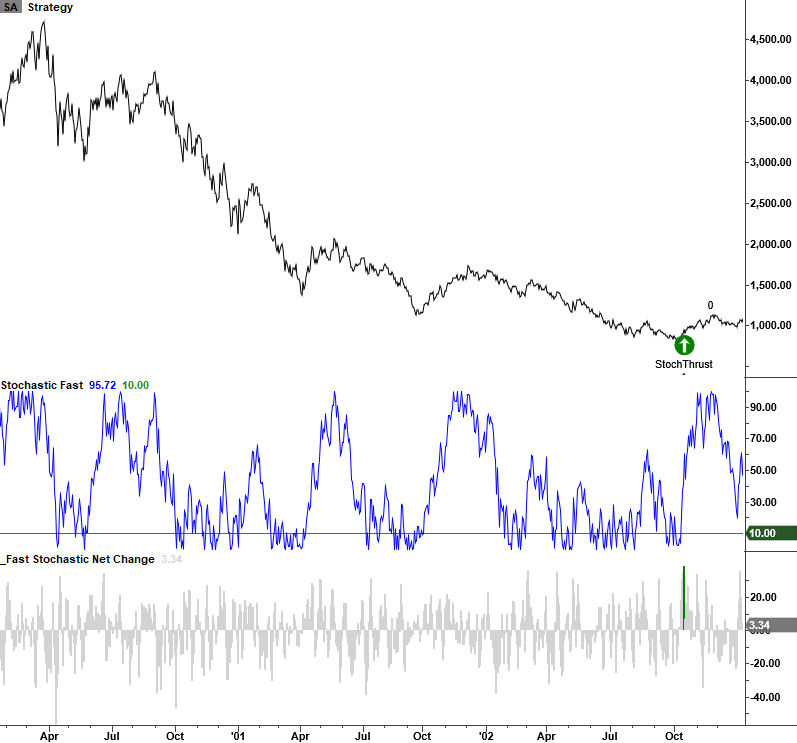
NASDAQ 100 CHART PERSPECTIVE
The model handled the 2000-02 bear market well. The 3-day net change did not surge above the user-defined threshold level until October 2002.
CURRENT ENVIRONMENT
Trading signals for the fast stochastic net change reversal concept have been absent, with only a handful of oversold conditions. When an oversold condition has developed, the momentum surge requirement is lacking.