Data &
Technology
Research
Reports
Report Solutions
Reports Library
Actionable
Strategies
Free
Resources
Simple Backtest Calculator
Simple Seasonality Calculator
The Kelly Criterion Calculator
Sentiment Geo Map
Public Research Reports
Free Webinar
Pricing
Company
About
Meet Our Team
In the News
Testimonials
Client Success Stories
Contact
Log inLoginSign up
< BACK TO ALL REPORTS

Still doing the splits

Jason Goepfert
2021-03-09
There has been a big split among winners and losers in the market, thanks to the influence of SPACs.

To one of the greatest degrees in history, we're seeing a large number of securities at 52-week highs and a large number at 52-week lows at the same time.

There is no doubt this is being heavily influenced by the sudden drop in SPACs, which have been distorting the breadth numbers for months. Whenever there is a split like this, there's always an excuse. In prior years, the split was "only" because of bank stocks, or energy stocks, or rate-sensitive issues. The vast majority of the time, that doesn't matter. It is what it is. Trying to outsmart the indicators and guess when they matter and when they don't has never been consistently successful.

This kind of split is what makes the HiLo Logic Index spike higher. The indicator is simply the lesser of 52-week highs and 52-week lows. Bull markets are typically preceded by very low readings, when everything is in gear one way or the other. Bear markets, or at least tough market conditions, tend to be preceded by times when markets are split between winners and losers. Like now.

Over the past 5 days, the HiLo Logic Indexes on both the NYSE and Nasdaq have averaged a very high reading. In recent years, this has had a mixed record, roughly preceding 3 rallies and 4 declines. Generally, if it was going to matter, then it mattered right away.

nyse hilo logic index

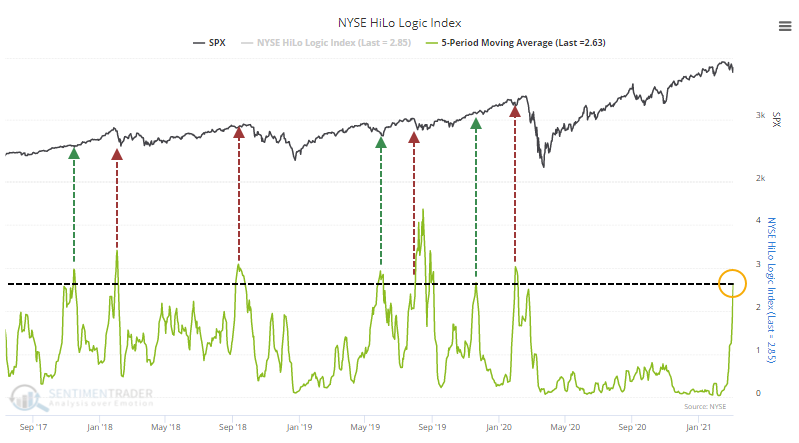
Over a long time frame, the Backtest Engine shows that anytime the NYSE figure averaged more than 2.5 over a week, forward returns were very poor, with a positive return over the next 2 months 40% of the time.

What else we're looking at

  • Full returns following jumps in the NYSE HiLo Logic Index
  • Same for the Nasdaq HiLo Logic Index, and what happens when they happen in conjunction
  • Chip maker AMD shows a definite pattern during the spring - and an options trade idea
  • The 6-month change in the energy sector is historic - what it's meant after other thrusts
  • Internal breadth among energy stock is among the strongest since 1950
  • There has never been a time with so many energy stocks outperforming the S&P

Stat Box

It took the Nasdaq Composite only 15 trading days to cycle from an all-time high to a correction, generally defined as a 10% or larger pullback. That's the 9th-quickest correction in the index's history dating back to 1971.


Etcetera

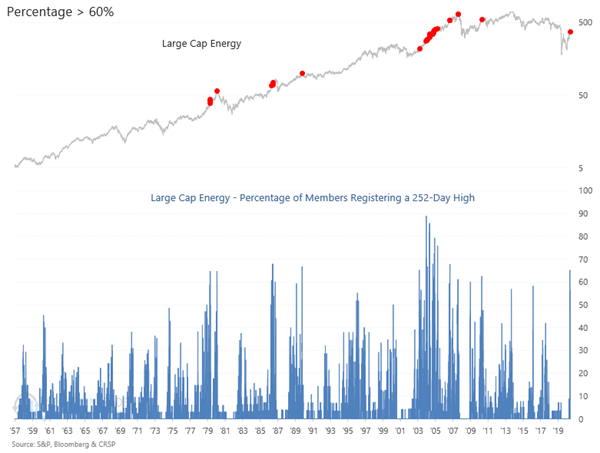
A lot of energy. More than 60% of large-cap energy stocks registered a 52-week high recently. That's among the highest percentages in 70 years. Source: CRSP, S&P, Bloomberg, SentimenTrader

percent of energy stocks at new high

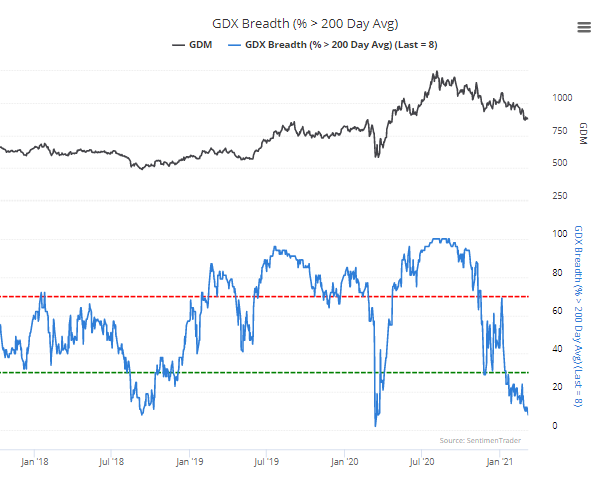
Gold's not glittering, though. Gold mining stocks have steadily slid in recent months, and now only 8% of gold mining stocks are holding above their 200-day moving averages. That's among the lowest readings in years. Source: SentimenTrader

percent of gold mining stocks miners above 200 day average

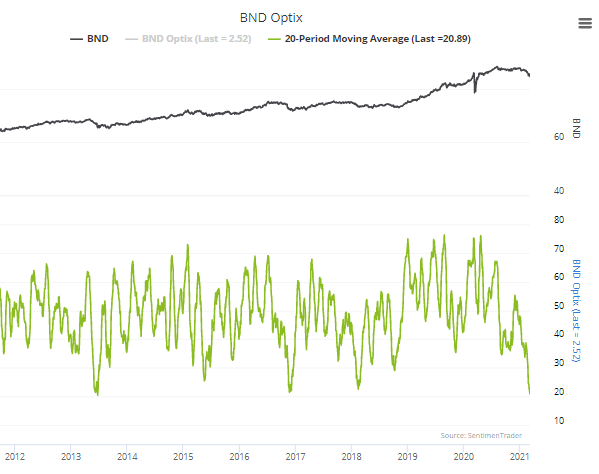
Not so safe haven. The popular broad bond fund, BND, has dripped lower in recent weeks. The Optimism Index for the fund has averaged barely above 20% over the past month, nearly a record low since the fund's inception. Source: SentimenTrader

bond etf bnd optimism sentiment

DATA &
TECHnologies
IndicatorEdge
‍
BackTestEdge
‍
Other Tools
‍
DataEdge API
RESEARCH
reports
Research Solution
‍
Reports Library
‍
actionable
Strategies
Trading Strategies
‍
Smart Stock Scanner
‍
FREE
RESOUrCES
Simple Backtest
Calculator
Simple Seasonality
Calculator
The Kelly Criterion
Calculator
Sentiment Geo Map
‍
Public Research Reports
‍
Free Webinar
COMPANY
‍
About
‍
Meet our Team
‍
In the News
‍
Testimonials
‍
Client Success Stories
Pricing
Bundle pricing
‍
Announcements
‍
FAQ
© 2024 Sundial Capital Research Inc. All rights reserved.
Setsail Marketing
TermsPrivacyAffiliate Program
Risk Disclosure: Futures and forex trading contains substantial risk and is not for every investor. An investor could potentially lose all or more than the initial investment. Risk capital is money that can be lost without jeopardizing ones’ financial security or life style. Only risk capital should be used for trading and only those with sufficient risk capital should consider trading. Past performance is not necessarily indicative of future results.

Hypothetical Performance Disclosure: Hypothetical performance results have many inherent limitations, some of which are described below. No representation is being made that any account will or is likely to achieve profits or losses similar to those shown; in fact, there are frequently sharp differences between hypothetical performance results and the actual results subsequently achieved by any particular trading program. One of the limitations of hypothetical performance results is that they are generally prepared with the benefit of hindsight. In addition, hypothetical trading does not involve financial risk, and no hypothetical trading record can completely account for the impact of financial risk of actual trading. for example, the ability to withstand losses or to adhere to a particular trading program in spite of trading losses are material points which can also adversely affect actual trading results. There are numerous other factors related to the markets in general or to the implementation of any specific trading program which cannot be fully accounted for in the preparation of hypothetical performance results and all which can adversely affect trading results.

Testimonial Disclosure: Testimonials appearing on this website may not be representative of other clients or customers and is not a guarantee of future performance or success.