Data &
Technology
Research
Reports
Report Solutions
Reports Library
Actionable
Strategies
Free
Resources
Simple Backtest Calculator
Simple Seasonality Calculator
The Kelly Criterion Calculator
Sentiment Geo Map
Public Research Reports
Free Webinar
Pricing
Company
About
Meet Our Team
In the News
Testimonials
Client Success Stories
Contact
Log inLoginSign up
< BACK TO ALL REPORTS

Staples Stocks Haven't Done This in 6 Years

Jason Goepfert
2021-10-07
Consumer Staples stocks have suffered internal selling pressure, enough to push its McClellan Summation Index to oversold territory.

Consumer Staples stocks rarely get investors excited. Now is definitely one of those times.

Thanks to lagging stock prices and shrinking market cap while other sectors gain, Staples' share of the S&P 500 has shrunk below 6% for only the 2nd time in 30 years, according to Bloomberg calculations. That happened in early 2000 as stocks were peaking, and Staples went on to massive outperformance over the next couple of years.

So many of the stocks have been forgotten, for so long, that the McClellan Summation Index for the sector has dropped below -500, enough to consider it deeply oversold. Curiously, this triggered even though the sector itself has been holding above a rising 200-day moving average. According to our Backtest Engine, that wasn't the case the last two times the Summation Index fell to such a low level.

XLP Consumer Staples breadth McClellan Summation Index

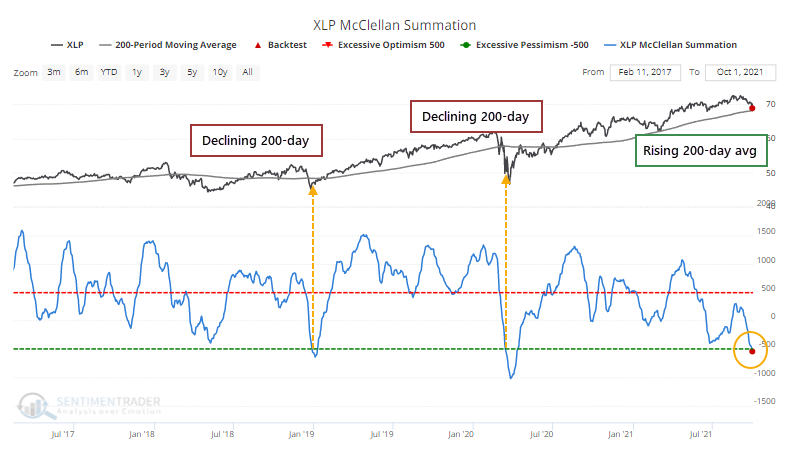
The total return on Staples when it was trading above a rising 200-day moving average and the Summation Index fell below -500 was positive across all time frames, with especially positive returns over the next six months. Out of the 18 signals, 16 showed a positive return over that time frame.


What else we're looking at

  • Total returns in Consumer Staples when the stocks get oversold in uptrends
  • A look at insider buying and selling activity, options trading, and correlations within the Staples sector
  • A bond switching strategy based on real interest rates
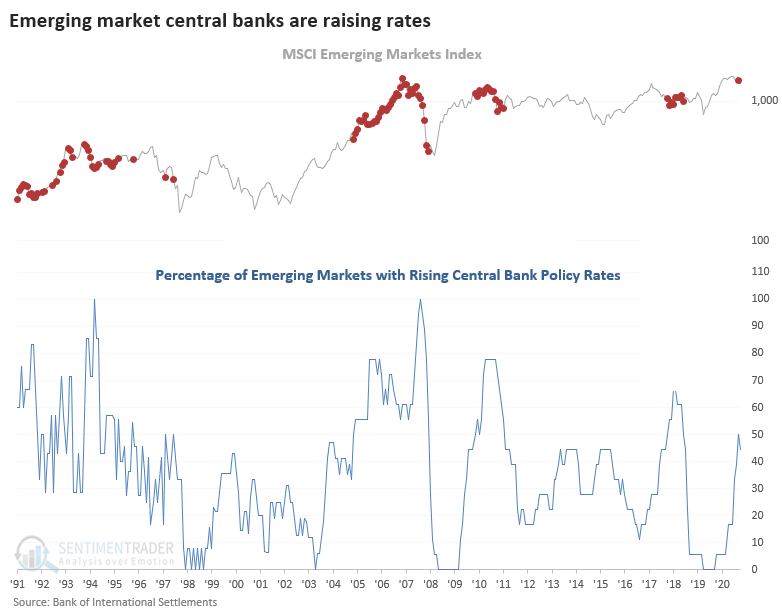
  • A detailed look at inflation and central bank policies in emerging markets

Stat box

Every stock in the Swiss Market Index is trading below its 50-day moving average for only the 2nd time in two years. The other was a multi-week stretch during the pandemic crash.

Etcetera

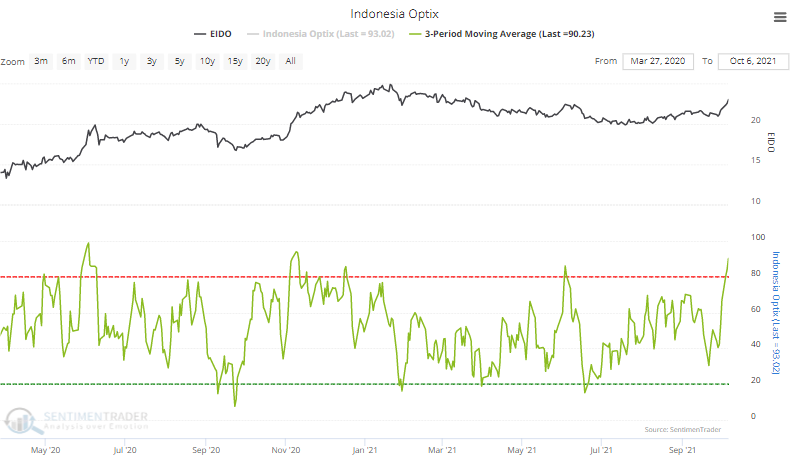
Asian optimism. The Optimism Index on the EIDO Indonesia fund has averaged more than 90% over the past three days, one of the highest readings in its history. This is a stark difference from sentiment in other Asian markets.

eido indonesia optimism sentiment

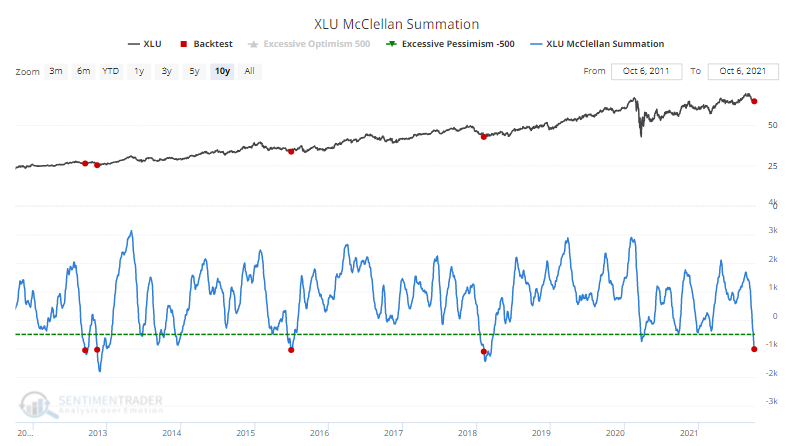
Utilities poled. Optimistic sentiment is not an issue in the Utilities sector. The McClellan Summation Index for the sector just crossed below -1000 for one of the few times in the past decade.

xlu utilities breadth mcclellan summation index

Emerging headwinds. Dean calculates that nearly 50% of emerging market economies have a central bank that is raising their target interest rate. Those markets show a lower annualized return when more than half of them are raising rates.

percentage of emerging market central banks raising rates

DATA &
TECHnologies
IndicatorEdge
‍
BackTestEdge
‍
Other Tools
‍
DataEdge API
RESEARCH
reports
Research Solution
‍
Reports Library
‍
actionable
Strategies
Trading Strategies
‍
Smart Stock Scanner
‍
FREE
RESOUrCES
Simple Backtest
Calculator
Simple Seasonality
Calculator
The Kelly Criterion
Calculator
Sentiment Geo Map
‍
Public Research Reports
‍
Free Webinar
COMPANY
‍
About
‍
Meet our Team
‍
In the News
‍
Testimonials
‍
Client Success Stories
Pricing
Bundle pricing
‍
Announcements
‍
FAQ
© 2024 Sundial Capital Research Inc. All rights reserved.
Setsail Marketing
TermsPrivacyAffiliate Program
Risk Disclosure: Futures and forex trading contains substantial risk and is not for every investor. An investor could potentially lose all or more than the initial investment. Risk capital is money that can be lost without jeopardizing ones’ financial security or life style. Only risk capital should be used for trading and only those with sufficient risk capital should consider trading. Past performance is not necessarily indicative of future results.

Hypothetical Performance Disclosure: Hypothetical performance results have many inherent limitations, some of which are described below. No representation is being made that any account will or is likely to achieve profits or losses similar to those shown; in fact, there are frequently sharp differences between hypothetical performance results and the actual results subsequently achieved by any particular trading program. One of the limitations of hypothetical performance results is that they are generally prepared with the benefit of hindsight. In addition, hypothetical trading does not involve financial risk, and no hypothetical trading record can completely account for the impact of financial risk of actual trading. for example, the ability to withstand losses or to adhere to a particular trading program in spite of trading losses are material points which can also adversely affect actual trading results. There are numerous other factors related to the markets in general or to the implementation of any specific trading program which cannot be fully accounted for in the preparation of hypothetical performance results and all which can adversely affect trading results.

Testimonial Disclosure: Testimonials appearing on this website may not be representative of other clients or customers and is not a guarantee of future performance or success.