
Stacking the Seasonal Odds in Real Estate

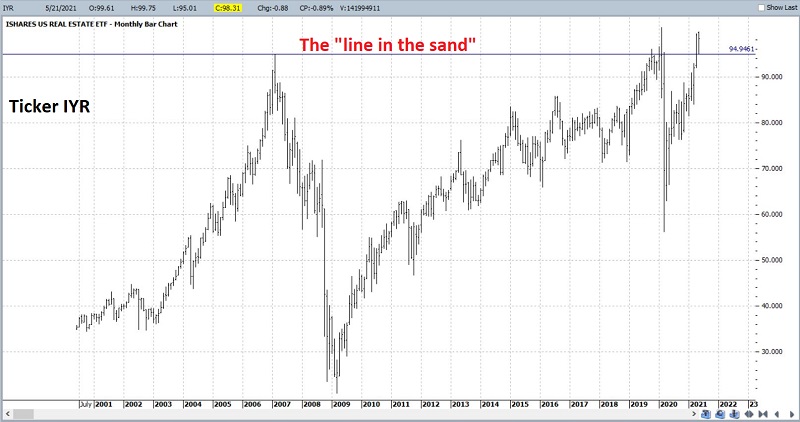
The real estate business has been strong of late. In the chart below, you can see that ticker IYR - an ETF that tracks the Dow Jones U.S. Real Estate Index - has attempted to break out to new all-time highs in recent months. There is much speculation about whether this attempted breakout will follow through to the upside - or form a bull trap and drop back below the "line in the sand."
A FAVORABLE ANNUAL SEASONAL PERIOD
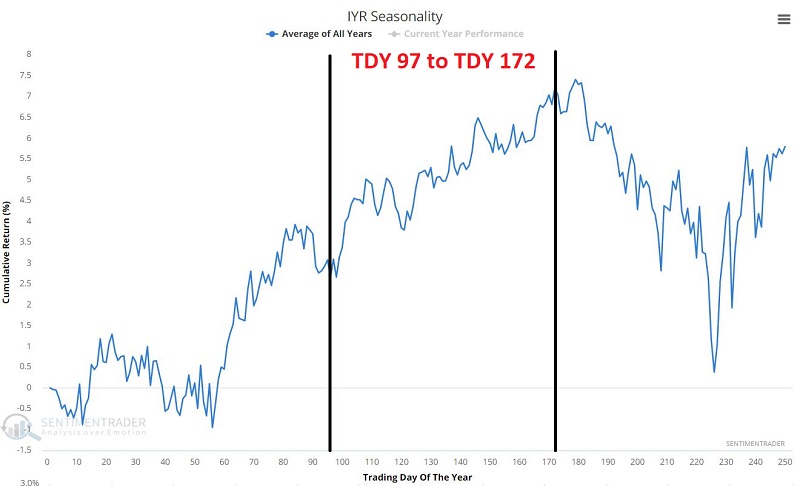
We can't predict the future. Still, the annual seasonal trend for IYR suggests at least giving the bullish case the benefit of the doubt for now. The chart below displays the annual seasonal trend for ticker IYR. As usual, it needs to be remembered that seasonality charts display previous "tendencies" and DO NOT serve as a "roadmap."
That said, IYR has shown a historical tendency to advance between Trading Day of Year (TDY) #97 and #172. In 20201, this equates to the close on 5/21/2021 and the close on 9/8/2021.
If we look at an equity curve displaying the cumulative % +(-) for IYR ONLY during this period each year since inception in 2000, we get the chart below.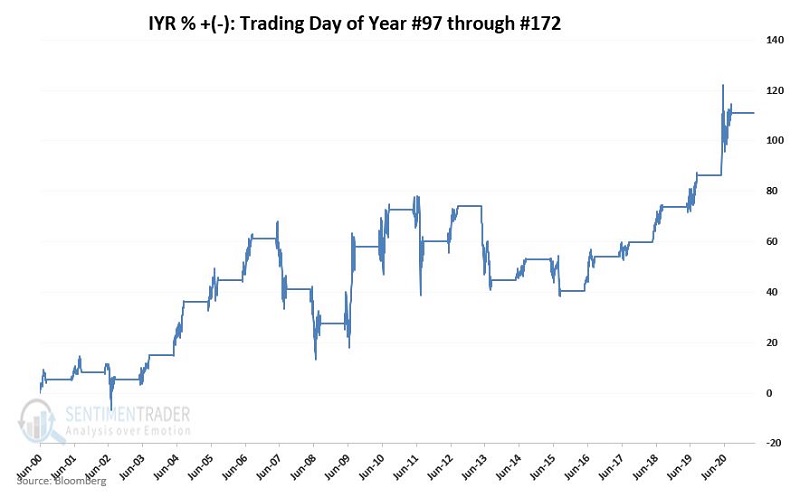
Key things to note during this seasonally favorable time of year:
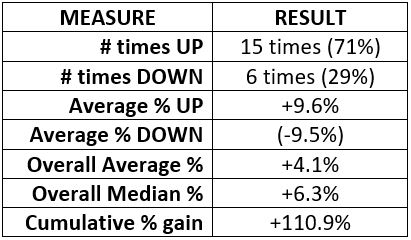
71% accuracy is significant. That said, let's add another seasonal concept and see if we can improve our odds of success.
SEASONALLY FAVORABLE TRADING DAYS OF THE MONTH
Historically, real estate-related stocks have shown a tendency to perform much better during certain "Trading Days of Month" (TDM). Those favorable days include:
- The first and second trading days of the month (TDM 1 and 2)
- Trading days #10, 11 and 12
- The last 4 trading day of the month (TDM -4, -3, -2, -1, with TDM -1 representing the last trading day of the month)
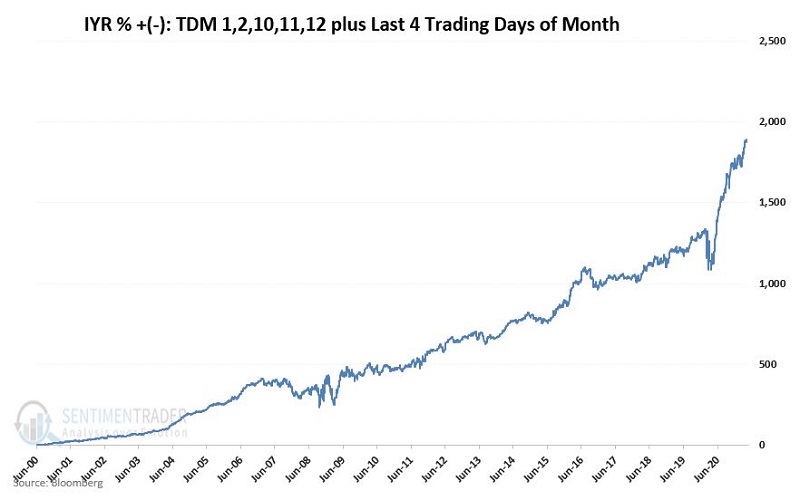
The chart below displays the cumulative price gain for IYR if held ONLY the 9 "favorable" days shown above every month since 2000. The cumulative result is a gain of +1,906%
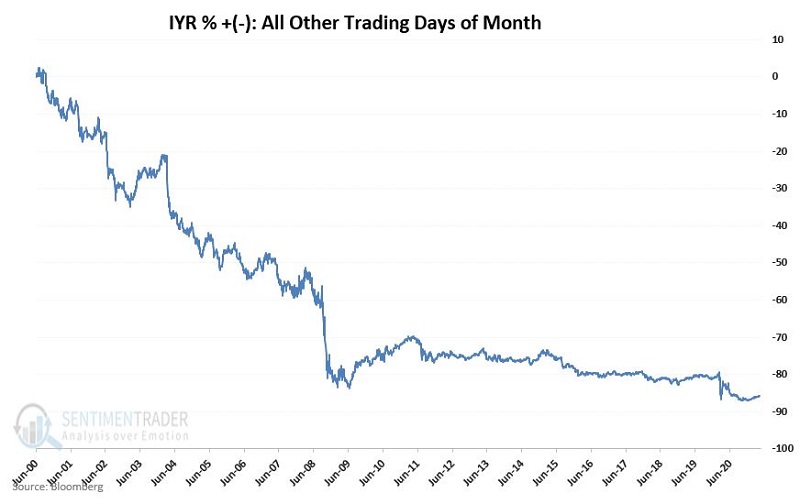
At the other end of the spectrum, the chart below displays the cumulative price gain for IYR if held ONLY during ALL OTHER trading days of the month every month since 2000. The cumulative result is a loss of -86%
COMBINING FAVORABLE TDY AND FAVORABLE TDM
Now let's put the two seasonal trends together. Specifically, we will look at the price-performance for IYR:
- From TDY 97 through 172 ONLY during the 9 seasonally favorable trading days of the month
- From TDY 97 through 172 ONLY during ALL OTHER trading days of the month
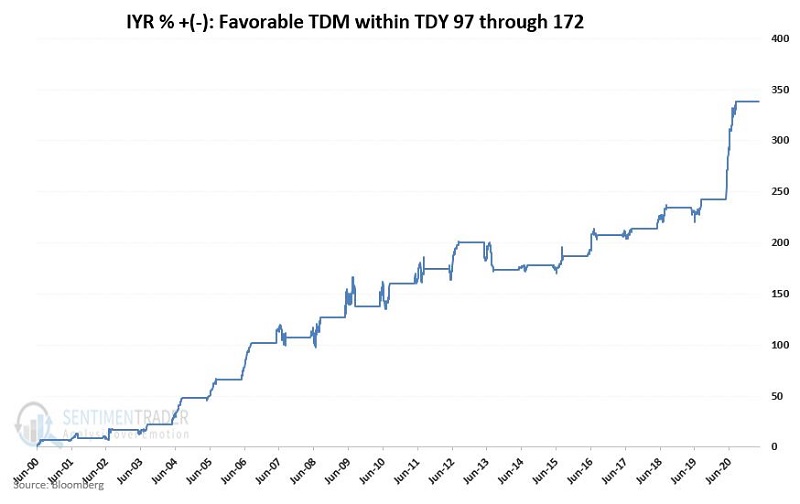
The chart below displays the cumulative price performance for IYR if held ONLY WHEN:
- The current TDY is above 97 and less than or equal to 172
- AND the current TDM is #1, 2, 10, 11, 12 or one of the last 4 trading days of the month
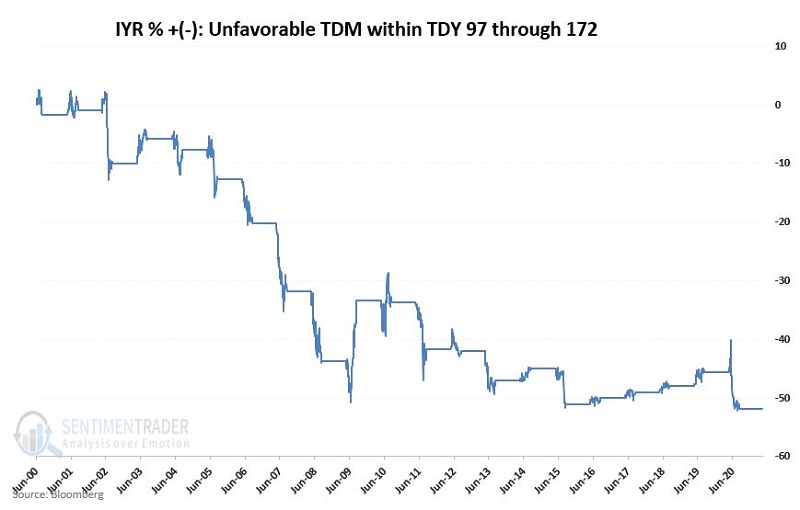
The chart below displays the cumulative price performance for IYR if held ONLY WHEN:
- The current TDY is above 97 and less than or equal to 172
- AND the current TDM IS NOT #1, 2, 10, 11, 12, or one of the last 4 trading days of the month
COMPARATIVE RESULTS
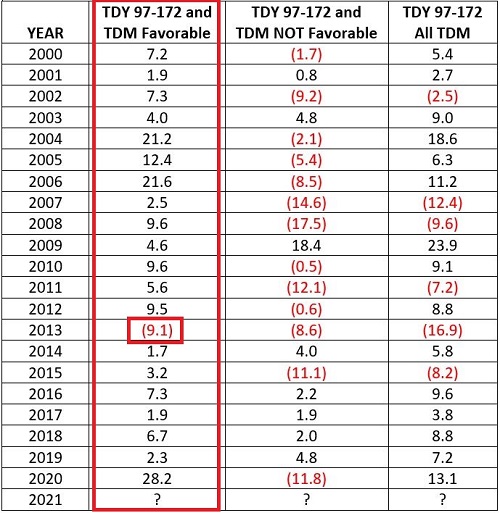
In the table below:
Column 1 displays the Year
Column 2 displays the % + (-) if BOTH TDY and TDM are favorable
Column 3 displays the % + (-) if TDY is favorable and TDM is NOT favorable
Column 4 displays the % +(-) if IYR is held during ALL days between TDY 97 and 172
The table below summarizes the results in the table above.
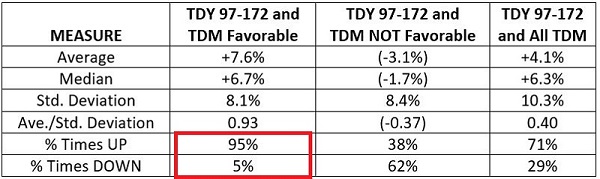
The key things to note are that holding IYR ONLY when both TDY and TDM are BOTH favorable resulted in:
- a higher average gain (+7.6% versus +4.1%)
- a lower standard deviation (8.1% versus 10.3%)
- a higher percentage of gains (95% of all years versus 71% of all years)
2021
Replicating this strategy involves 7 roundtrip trade and therefore is not for everyone. In addition, we are not "recommending" this strategy; we are simply reporting on the results of our research. As always, it should be remembered that there are absolutely no "sure things" in trading and that past performance does not guarantee future results.
With all of the above caveats in mind, for 2021, the TDY favorable period extends from 5/21/2021 through the close on 9/8/2021.
The combined TDY and TDM favorable dates for 2021 are:
- 5/25 through 6/2 (last 4 TDM plus first 2 TDM)
- 6/14 through 6/16 (TDM 10 through 12)
- 6/25 through 7/2 (last 4 TDM plus first 2 TDM)
- 7/15 through 7/19 (TDM 10 through 12)
- 7/27 through 8/3 (last 4 TDM plus first 2 TDM)
- 8/13 through 8/17 (TDM 10 through 12)
- 8/26 through 9/2 (last 4 TDM plus first 2 TDM)