Data &
Technology
Research
Reports
Report Solutions
Reports Library
Actionable
Strategies
Free
Resources
Simple Backtest Calculator
Simple Seasonality Calculator
The Kelly Criterion Calculator
Sentiment Geo Map
Public Research Reports
Free Webinar
Pricing
Company
About
Meet Our Team
In the News
Testimonials
Client Success Stories
Contact
Log inLoginSign up
< BACK TO ALL REPORTS

SPY Liquidity Premium Strategy

Eric D. Brown
2016-09-15
null

In yesterday's report titled No New Highs In S&P 500 As Fear-Based Fund Volume Surges (published Sept 14 2016), Jason mentioned a stat regarding the SPY Liquidity Premium indicator.  Jason's comment was:

There are few signs of extreme pessimism, but ETF volume is one. Even just looking at the main S&P 500 fund, SPY, volume has been extremely heavy relative to volume in the underlying stocks, suggesting extreme discomfort from investors in holding individual stocks, and pushing the SPY Liquidity Premium to 35%. That has been a consistently good sign that sentiment is stretched, with the S&P returning an annualized gain of 37.3% when the Premium is above 35%. It's one of only a handful of our indicators showing pessimism.

I wanted to see what this particular stat looked like from an automated trading strategy standpoint.

Using SPY Liquidity Premium and SPY, I built a quick strategy similar to the previous ones I've built. The rules are:

  1. Long only
  2. No Margin. Starting Account size is $250K.
  3. 1,000 shares of SPY ETF
  4. Commission of 0.01% per trade
  5. $0.01 per share slippage
  6. Go long when:

    • SPY Liquidity Premium is greater than or equal to 0.35 (Jason's Highlighted level in this note and above the Pessimistic Extreme of 0.2)
    • SPY is above the 200 day Moving Average

  7. Close Longs when:

    • SPY Liquidity Premium is less than or equal to -0.2 (Optimistic Extreme)

  8. All orders are entered at the open of the next day’s trading session after a signal is given.
  9. There are no stops used. Positions are held until a close signal is given.

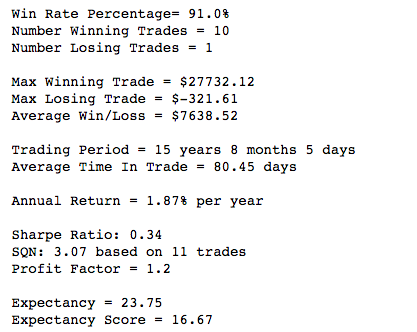
The strategy covers the timeframe from Jan 1 2001 to Sept 14 2016.  The strategy resulted in only 11 trades total with 10 wins and 1 loss (91.0% win rate). The trade stats are shown in Table 1.

[caption id="attachment_820" align="aligncenter" width="417"]Trade stats - SPY Liquidity Premium Table 1: Trade stats - SPY Liquidity Premium[/caption]

As you can see,  this strategy generates a 1.87% annualized return on a simple entry/exit strategy but it generates about a 2.5% per trade return (see Table 2 below).

[caption id="attachment_814" align="aligncenter" width="410"]SPY Liquidity Premium Return Stats 
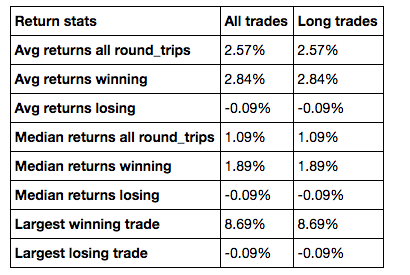
Table 2: SPY Liquidity Premium Return Stats[/caption]

The strategy's maximum drawdown was 9%.  With only 11 trades, you can't really get too excited about the strategy, but the results do hint at some positive bias when the SPY Liquidity Premium closed at 35% or higher.

Note: The 200MA filter on this strategy removes quite a few trades but increases the return (and reduces drawdown). Removing the 200MA filter reduces returns to 1.33% per year from 1.87% and also increases volatility / drawdown significantly.

Sorry, you don't have access to this report

Upgrade your subscription plan to get access
Go to Dasboard
DATA &
TECHnologies
IndicatorEdge
‍
BackTestEdge
‍
Other Tools
‍
DataEdge API
RESEARCH
reports
Research Solution
‍
Reports Library
‍
actionable
Strategies
Trading Strategies
‍
Smart Stock Scanner
‍
FREE
RESOUrCES
Simple Backtest
Calculator
Simple Seasonality
Calculator
The Kelly Criterion
Calculator
Sentiment Geo Map
‍
Public Research Reports
‍
Free Webinar
COMPANY
‍
About
‍
Meet our Team
‍
In the News
‍
Testimonials
‍
Client Success Stories
Pricing
Bundle pricing
‍
Announcements
‍
FAQ
© 2024 Sundial Capital Research Inc. All rights reserved.
Setsail Marketing
TermsPrivacyAffiliate Program
Risk Disclosure: Futures and forex trading contains substantial risk and is not for every investor. An investor could potentially lose all or more than the initial investment. Risk capital is money that can be lost without jeopardizing ones’ financial security or life style. Only risk capital should be used for trading and only those with sufficient risk capital should consider trading. Past performance is not necessarily indicative of future results.

Hypothetical Performance Disclosure: Hypothetical performance results have many inherent limitations, some of which are described below. No representation is being made that any account will or is likely to achieve profits or losses similar to those shown; in fact, there are frequently sharp differences between hypothetical performance results and the actual results subsequently achieved by any particular trading program. One of the limitations of hypothetical performance results is that they are generally prepared with the benefit of hindsight. In addition, hypothetical trading does not involve financial risk, and no hypothetical trading record can completely account for the impact of financial risk of actual trading. for example, the ability to withstand losses or to adhere to a particular trading program in spite of trading losses are material points which can also adversely affect actual trading results. There are numerous other factors related to the markets in general or to the implementation of any specific trading program which cannot be fully accounted for in the preparation of hypothetical performance results and all which can adversely affect trading results.

Testimonial Disclosure: Testimonials appearing on this website may not be representative of other clients or customers and is not a guarantee of future performance or success.