Data &
Technology
Research
Reports
Report Solutions
Reports Library
Actionable
Strategies
Free
Resources
Simple Backtest Calculator
Simple Seasonality Calculator
The Kelly Criterion Calculator
Sentiment Geo Map
Public Research Reports
Free Webinar
Pricing
Company
About
Meet Our Team
In the News
Testimonials
Client Success Stories
Contact
Log inLoginSign up
< BACK TO ALL REPORTS

Split Markets As Volatility Spikes

Jason Goepfert
2020-01-30
The market is split, with the HiLo Logic Index rising above 3. Volatility has jumped, with the VIX and VXO spiking 50%.

Split again

While we still haven’t seen a big cluster like last fall (which failed), technical warning signs are popping up again. That’s clearly the case when looking at the HiLo Logic Index, which once again spiked above 3. This means that there were at least 3% of NYSE securities at a 52-week high and at least 3% of them at a 52-week low.

NYSE HiLo Logic Index

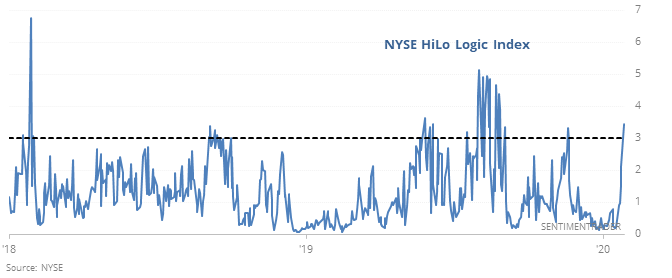
Since 1965, the S&P 500's annualized return when the HiLo Logic Index was above 3 was a wretched -17.6%, meaning that stocks struggled to show meaningful gains when stocks were "split."
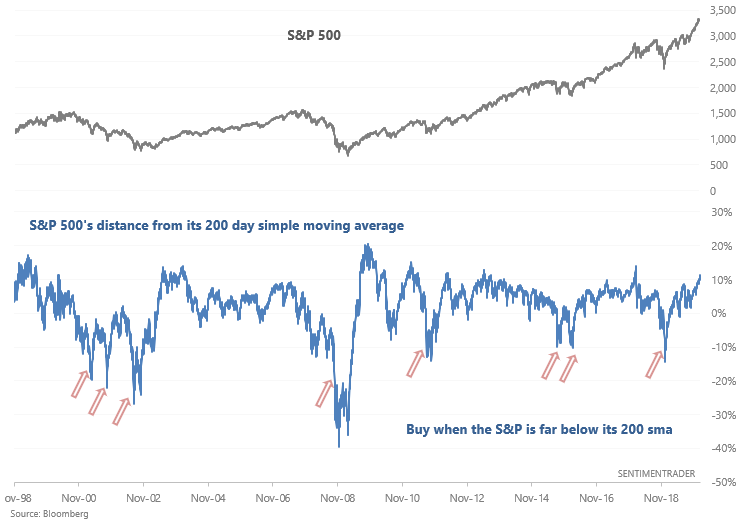

Moving Averages

Curious about common technical indicators and whether they're effective? How best to use them? They can often be useful, but you may be surprised when, and on what markets.

S&P 500 distance from 200 day moving average

Troy has posted some in-depth instructional articles as well as videos - check them out and you will likely learn (or dis-learn) potentially important information.

  • Moving Averages: How to Use it and Does it actually work?
  • Stochastic Indicator SECRETS: everything you need to know
  • MACD: EVERYTHING you need to know
  • Hindenburg Omen: EVERYTHING you need to know


Volatility spike

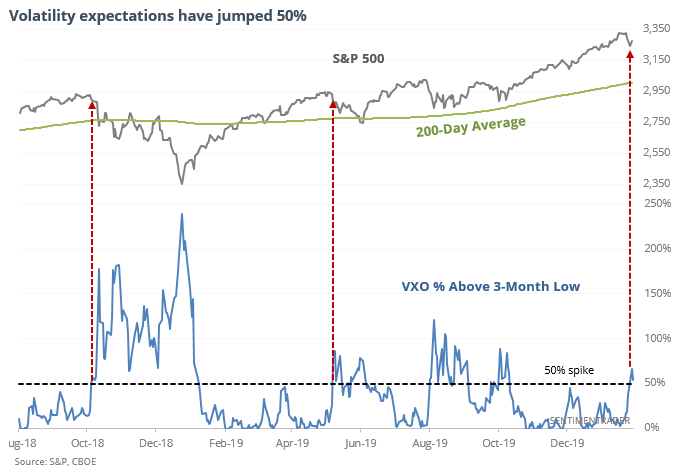
Stocks remain solidly in uptrends, yet volatility expectations for the next 30 days have jumped. According to CNBC, this is a medium- to long-term buy signal for stocks.

“What we like to do is look at VIX versus where it’s been over the last three months. This was a 50% spike in the VIX off that three-month low. Typically, when you get those spikes of 50% and the S&P 500 is still above its 200-day moving average, as is the case, when you get a spike in an uptrend, you tend to have above-average returns six months out.”

Generally, this is sound advice. But the last two times it triggered didn’t work out so well for buyers.

Going back to 1986, it was not a good buy signal shorter-term, though as noted in the article, the return on stocks over the next 6 months was (slightly) better than random.

This is an abridged version of our recent reports and notes. For immediate access with no obligation, sign up for a 30-day free trial now.

We also looked at:

  • Wall Street analysts continue to favor technicals over fundamentals
  • Utilities have jumped 6% in only a month - what happens next
  • Fewer than 7 of the S&P's major sectors rose this month
  • There has been a spike in Hang Seng members below their volatility bands
  • What happens after copper hits a high then plunges
DATA &
TECHnologies
IndicatorEdge
‍
BackTestEdge
‍
Other Tools
‍
DataEdge API
RESEARCH
reports
Research Solution
‍
Reports Library
‍
actionable
Strategies
Trading Strategies
‍
Smart Stock Scanner
‍
FREE
RESOUrCES
Simple Backtest
Calculator
Simple Seasonality
Calculator
The Kelly Criterion
Calculator
Sentiment Geo Map
‍
Public Research Reports
‍
Free Webinar
COMPANY
‍
About
‍
Meet our Team
‍
In the News
‍
Testimonials
‍
Client Success Stories
Pricing
Bundle pricing
‍
Announcements
‍
FAQ
© 2024 Sundial Capital Research Inc. All rights reserved.
Setsail Marketing
TermsPrivacyAffiliate Program
Risk Disclosure: Futures and forex trading contains substantial risk and is not for every investor. An investor could potentially lose all or more than the initial investment. Risk capital is money that can be lost without jeopardizing ones’ financial security or life style. Only risk capital should be used for trading and only those with sufficient risk capital should consider trading. Past performance is not necessarily indicative of future results.

Hypothetical Performance Disclosure: Hypothetical performance results have many inherent limitations, some of which are described below. No representation is being made that any account will or is likely to achieve profits or losses similar to those shown; in fact, there are frequently sharp differences between hypothetical performance results and the actual results subsequently achieved by any particular trading program. One of the limitations of hypothetical performance results is that they are generally prepared with the benefit of hindsight. In addition, hypothetical trading does not involve financial risk, and no hypothetical trading record can completely account for the impact of financial risk of actual trading. for example, the ability to withstand losses or to adhere to a particular trading program in spite of trading losses are material points which can also adversely affect actual trading results. There are numerous other factors related to the markets in general or to the implementation of any specific trading program which cannot be fully accounted for in the preparation of hypothetical performance results and all which can adversely affect trading results.

Testimonial Disclosure: Testimonials appearing on this website may not be representative of other clients or customers and is not a guarantee of future performance or success.