Data &
Technology
Research
Reports
Report Solutions
Reports Library
Actionable
Strategies
Free
Resources
Simple Backtest Calculator
Simple Seasonality Calculator
The Kelly Criterion Calculator
Sentiment Geo Map
Public Research Reports
Free Webinar
Pricing
Company
About
Meet Our Team
In the News
Testimonials
Client Success Stories
Contact
Log inLoginSign up
< BACK TO ALL REPORTS

Speculative volume skyrockets as smart money sells

Jason Goepfert
2021-02-10
Speculative volume on the Nasdaq, especially in penny stocks, has reached a fever pitch. At the same time, there has been persistent selling during the last hour of trading, commonly believed to be "smart money" investors.

Last month, there was a remarkable jump in the most speculative corners of the market, including leveraged vehicles like options and margin trading, and lottery ticket shares in the form of penny stocks.

The roaming horde of speculators found that niche in December, with more than 1 trillion shares traded. It picked up even more in January.

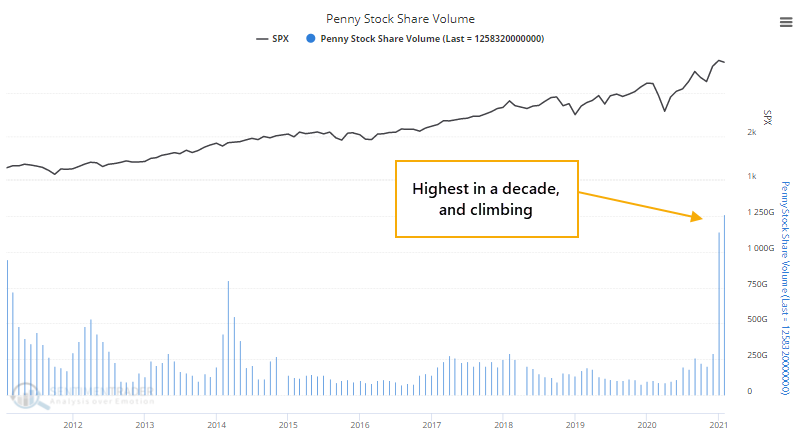
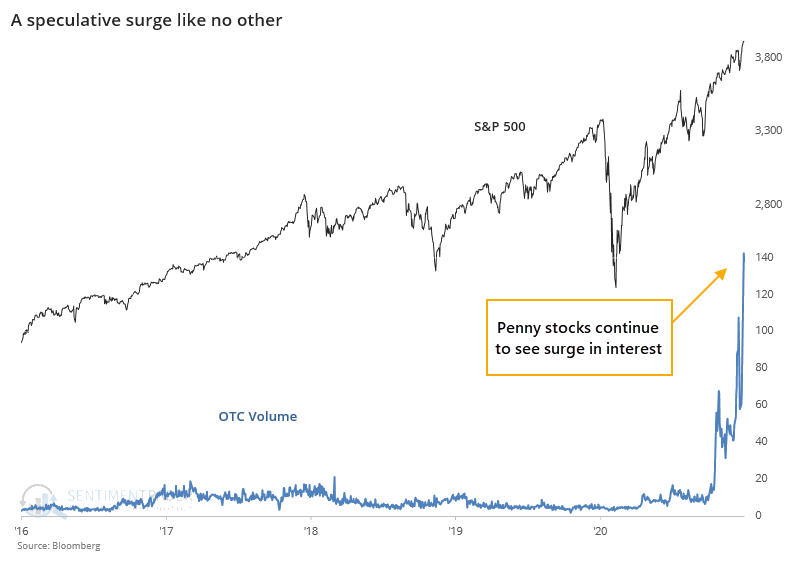
A Bloomberg calculation of over-the-counter activity has continued to rocket higher in recent weeks. We haven't seen anything anywhere near this type of speculative activity in the past 5 years, at least.

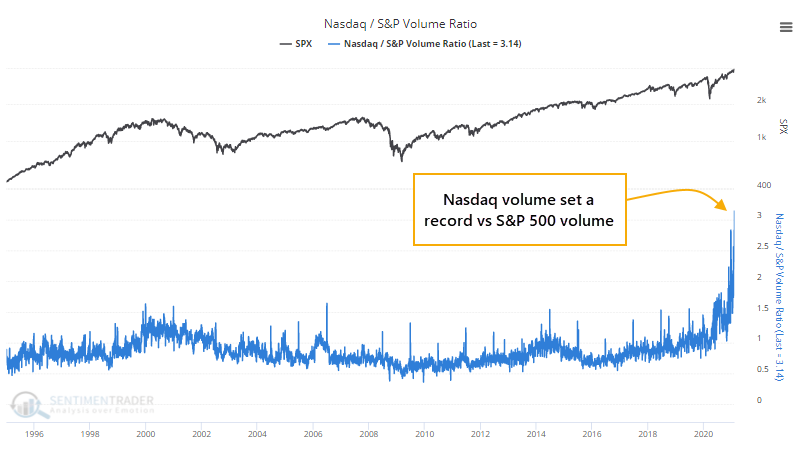
All of this activity has pushed the ratio of Nasdaq volume to S&P 500 volume to a record high. As a proxy for trading activity among speculators versus investors, once again we've never seen anything like the past month.

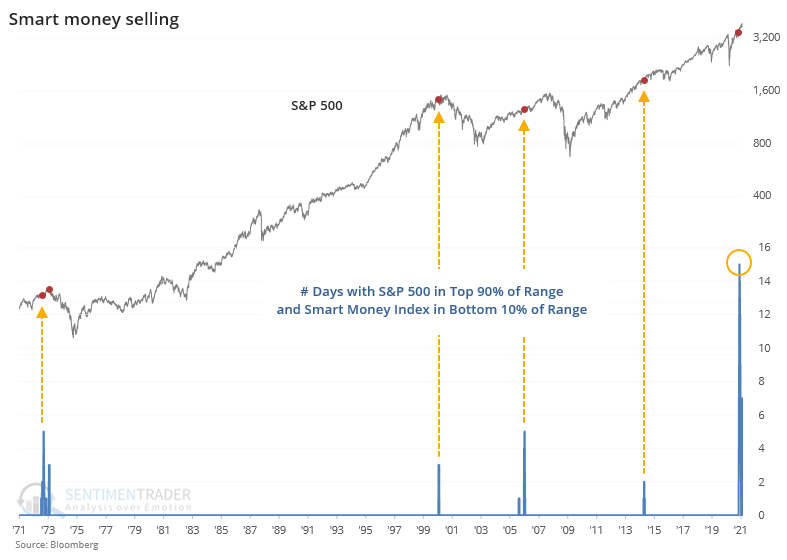
At the same time, the smart money is selling. At least, if we can consider activity during the last hour of trading to be the work of more informed investors, the theory behind the Smart Money Index. As calculated by Bloomberg, this measure is hanging near its lows despite indexes being at new highs.

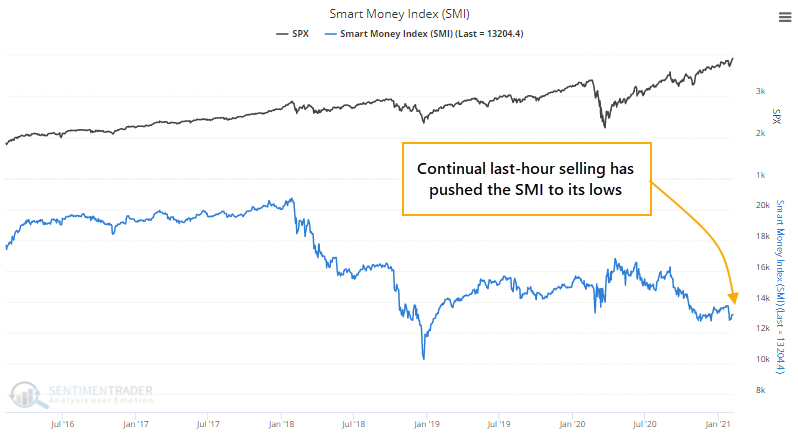
This has been the case for much of the past few weeks. So much so, that never before have we seen so many days when the S&P 500 was in the upper 90% of its 1-year range while the Smart Money Index is in the bottom 10% of its own 1-year range.

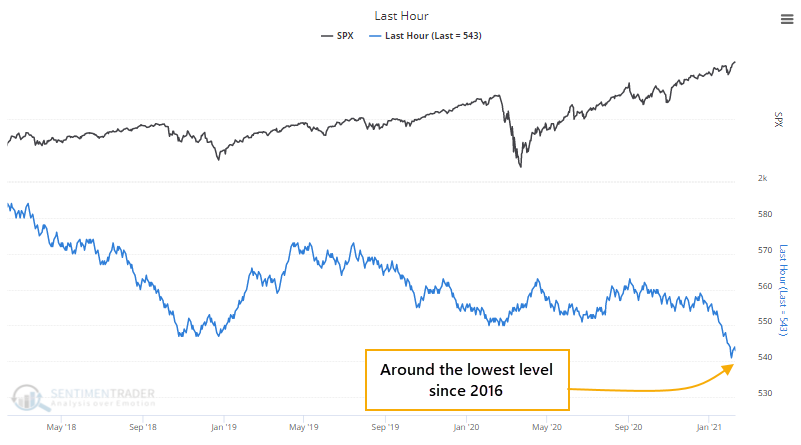
A little while back, Dean outlined a risk-off model he calculates using the last hour of trading. This is a cumulative advance/decline line of last-hour activity. If the S&P 500 rises during the last hour, then this indicator adds 1 to its running total; if the S&P sees selling to end the day, then the indicator subtracts 1. We've seen so much last-hour selling lately that this has been hovering near its lowest level since 2016.

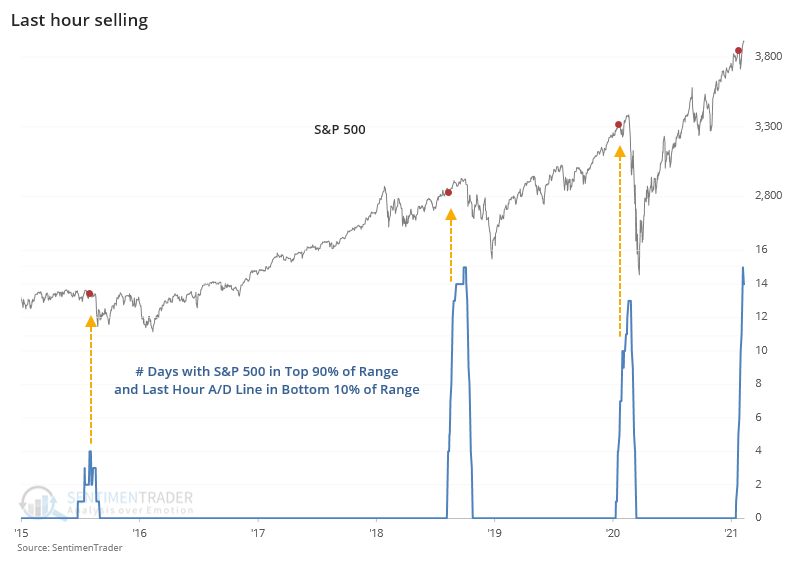
Again, we've never seen so many days with this measure near its lows while the S&P is near its highs.

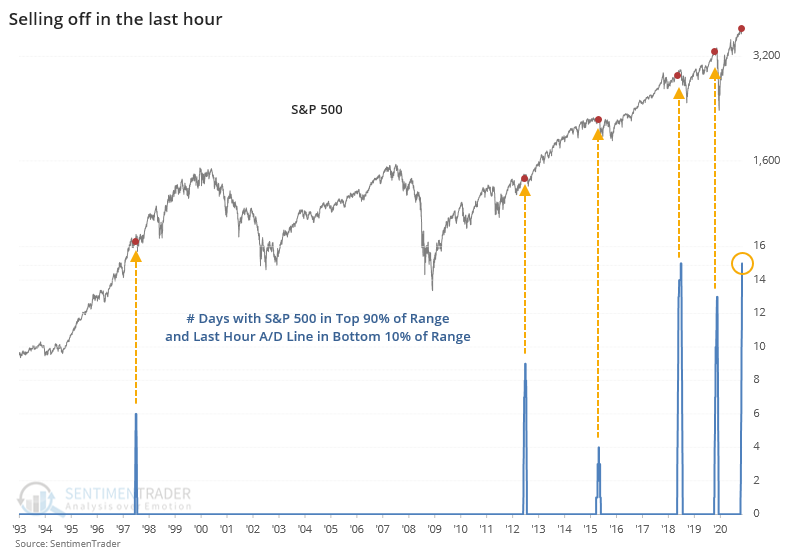
Its recent record is especially troubling.

There has been no shortage of signs of extreme, even record, speculation in recent weeks. The biggest counter-point to that has been widespread and impressive buying interest. That started to show some cracks in the past few weeks, but recent days have started to make up for it. It's a challenging dichotomy but risks in the short- to medium-term appear high, and the persistent last-hour selling adds to those concerns.

Sorry, you don't have access to this report

Upgrade your subscription plan to get access
Go to Dasboard
DATA &
TECHnologies
IndicatorEdge
‍
BackTestEdge
‍
Other Tools
‍
DataEdge API
RESEARCH
reports
Research Solution
‍
Reports Library
‍
actionable
Strategies
Trading Strategies
‍
Smart Stock Scanner
‍
FREE
RESOUrCES
Simple Backtest
Calculator
Simple Seasonality
Calculator
The Kelly Criterion
Calculator
Sentiment Geo Map
‍
Public Research Reports
‍
Free Webinar
COMPANY
‍
About
‍
Meet our Team
‍
In the News
‍
Testimonials
‍
Client Success Stories
Pricing
Bundle pricing
‍
Announcements
‍
FAQ
© 2024 Sundial Capital Research Inc. All rights reserved.
Setsail Marketing
TermsPrivacyAffiliate Program
Risk Disclosure: Futures and forex trading contains substantial risk and is not for every investor. An investor could potentially lose all or more than the initial investment. Risk capital is money that can be lost without jeopardizing ones’ financial security or life style. Only risk capital should be used for trading and only those with sufficient risk capital should consider trading. Past performance is not necessarily indicative of future results.

Hypothetical Performance Disclosure: Hypothetical performance results have many inherent limitations, some of which are described below. No representation is being made that any account will or is likely to achieve profits or losses similar to those shown; in fact, there are frequently sharp differences between hypothetical performance results and the actual results subsequently achieved by any particular trading program. One of the limitations of hypothetical performance results is that they are generally prepared with the benefit of hindsight. In addition, hypothetical trading does not involve financial risk, and no hypothetical trading record can completely account for the impact of financial risk of actual trading. for example, the ability to withstand losses or to adhere to a particular trading program in spite of trading losses are material points which can also adversely affect actual trading results. There are numerous other factors related to the markets in general or to the implementation of any specific trading program which cannot be fully accounted for in the preparation of hypothetical performance results and all which can adversely affect trading results.

Testimonial Disclosure: Testimonials appearing on this website may not be representative of other clients or customers and is not a guarantee of future performance or success.