
Speculation in semiconductors

Key Points
- The semiconductor sector (using SMH as a proxy for the sector) is entering a brief seasonally favorable period
- SMH Optix recently generated a potentially bullish signal
- Options trading in SMH is relatively thin and bid/ask spreads a relatively wide, so we will consider options on INTC instead
Ticker SMH
The chart below displays the annual seasonal trend for VanEck Vectors Semiconductor ETF (SMH). We are entering a brief seasonally favorable period that extends into the middle of February.
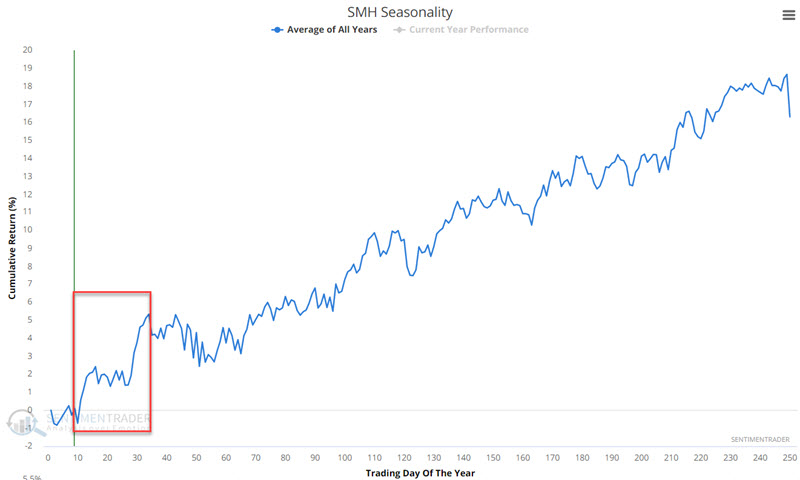
It is important to remember that no seasonal trend is sure to work each time around, and the seasonal charts are not roadmaps. In addition, given the weakness in the overall market of late, we will ultimately consider an options trade to limit dollar risk. Still, the implication is that action for semiconductor stocks may be favorable in the month or so just ahead.
In addition to the favorable seasonal trend, SMH Optix has also flashed a favorable sign recently. The red dots in the chart below display each time the 10-day average for SMH Optix has crossed above 40 while SMH was above its 200-day moving average.
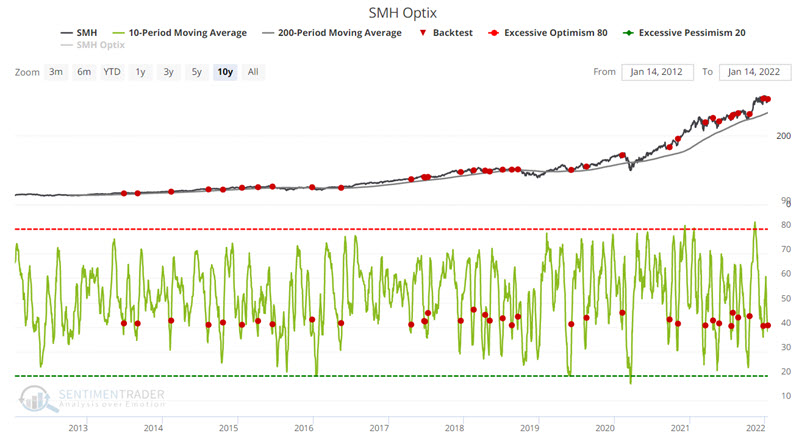
The table below displays a summary of performance following previous signals. Note that SMH has been higher 1-month later 79% of the time with an average gain of 3.44%.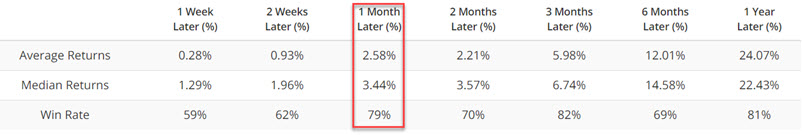
Based on these two favorable indications, a trader might consider a bullish position on semiconductors.
Entering a bullish trade
The most straightforward approach would be to buy shares of SMH. However, due to the high price of SMH shares, buying 100 shares would require a capital commitment of almost $30,000. In addition, options on SMH have relatively wide bid/ask spreads. Finally, the three semiconductor stocks with the most option trading volume (NVDA, AMD, and TSM) are also very high-priced stocks.
As a result of all of the above factors, we will focus on options on Intel (INTC), which, a) is a lower-priced stock in the group, and b) (typically) has the narrowest options bid/ask spreads.
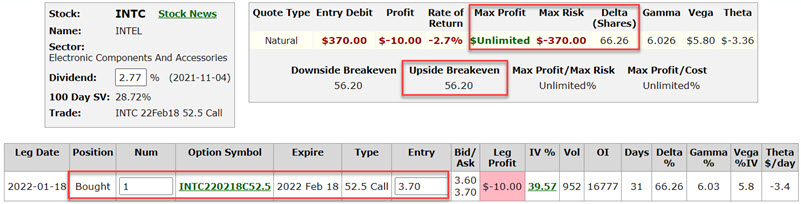
The example trade we will consider is a bull call spread using INTC call options expiring on February 18, 2022. The example trade involves:
- Buying 1 INTC Feb18 2022 52.5 call @ $3.70
The cost to buy a 1-lot is $370. A trader would decide what % of their trading capital they wish to commit and then trade the appropriate lot size. For example, a trader with $25,000 decides to commit 2% ($500). This trader would buy a 1-lot. If the same trader decided to commit 5% ($1,250), they could trade a 3-lot ($1,250 / $370).
The particulars and risk curves for this trade appear in the figures below.
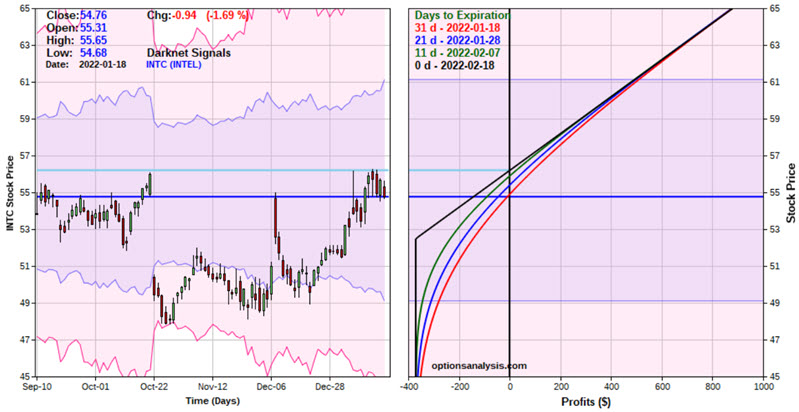
This trade is a low-dollar risk speculative bet that INTC will work its way higher sometime between now and February option expiration.
This must be considered as a highly speculative play for several reasons:
- If INTC must rise above the breakeven price ($56.20) by expiration or this trade will lose money
- If INTC is below the strike price (52.50) at expiration this trade will lose 100% of the premium paid
- We are using INTC as a proxy for the overall semiconductor sector. A key risk is that the overall sector may perform well, but INTC will not. In this case, a loss could occur even if the overall sector performs very well
Managing the trade
Once a trade is selected and entered, the keys to option trading success are determining in advance:
- What will cause you to exit with a profit
- What will cause you to exit with a loss
Exiting with a profit: The catalyst for this trade was expecting the semi sector to perform well over the coming month. So simply holding on through the close on 2/14 - i.e., one month after the Backtest Engine Optix signal on 1/14 - is a viable choice. Nevertheless, a trader might also develop some criteria to exit early, sell some, or adjust the original position if INTC moves sharply higher sooner than later.
Some possibilities include:
- Hold through 2/14, then exit
- If the trade has an open profit above $370 on a 1-lot prior to 2/14, a trader might consider "selling half" to lock in a profit and then let the rest ride through 2/14
Exiting with a loss: The key decision is whether to risk the entire amount spent to enter the trade or cut your loss at some point (FYI, there are no "correct" answers, only decisions to be made). This trade is a proxy for the overall semiconductor sector over the next month. However, it is also a bet on an upside breakout for INTC. The chart below (courtesy of Stockcharts) displays recent price action for INTC and the key resistance level.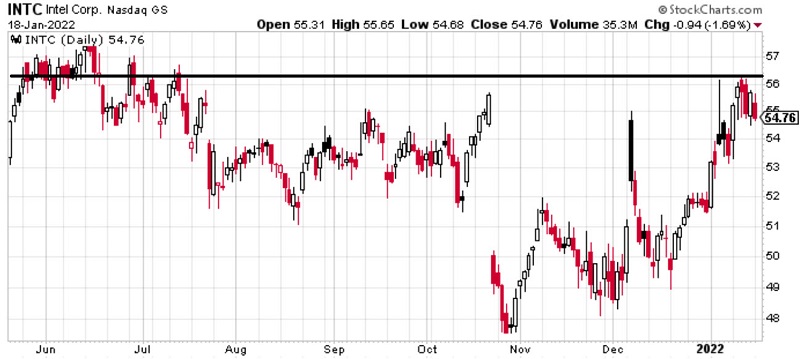
While the intention is to give this trade an entire month to work out, if the conditions below develop, a trader might consider bailing out early and trying to salvage some premium.
Consider an early exit if:
- INTC fails to breakout
- SMH languishes or declines
- The overall market remains weak
What the research tells us…
The current setup in the semiconductor industry (a favorable seasonal trend and a positive reversal in sentiment) has generally proven to be bullish in the past. As always, it is essential to note the critical distinction between "generally bullish" and "a sure thing this time around." Sure things do not exist in the financial markets. Regardless of what you trade and how you trade it, the keys are how you allocate capital (money management) and limit losses (risk management).