
Speculation in biotech

Key Points
- Biotech remains one of the most volatile and uncertain sectors around
- For a trader who can wisely allocate capital, speculation can be highly lucrative
- Our Optix indicator has flashed a potentially bullish sign for traders willing to speculate in the biotech sector
XBI Optix recovers from a low level
We have been watching the biotech sector closely of late (see Jason's recent highlight). On 12/2, I wrote about a potential setup in the works. That setup has now triggered. Let's take a closer look at the setup, the signal, previous results, and two ways to potentially play.
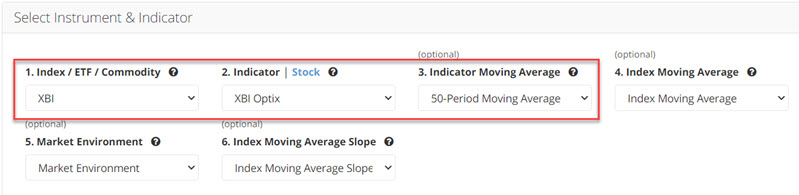
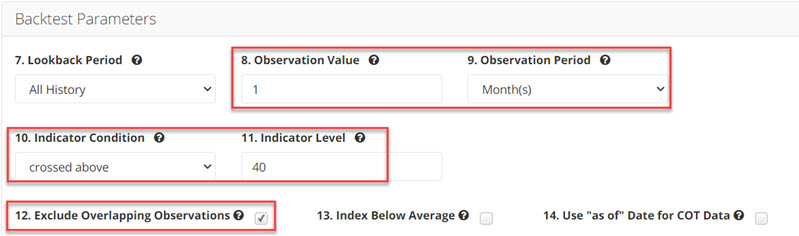
Let's consider the potential for using our Optimism Index (Optix) to play the long side using shares of the SPDR S&P Biotech ETF (XBI). The rule we will use is:
- The 50-day average for XBI Optix crosses above 40% for the first time in a month
For this signal to occur, the 50-day average for XBI Optix needs to drop below 40%. This typically unfolds over time when XBI experiences a significant decline. The input screens appear in the screenshots below. You can run this test in the Backtest Engine.
A 94% win rate over the next month
The signals generated by the rule above appear in the chart below. A new signal occurred after the close on Tuesday 12/21 (denoted by the red dot at the far right of the chart below).
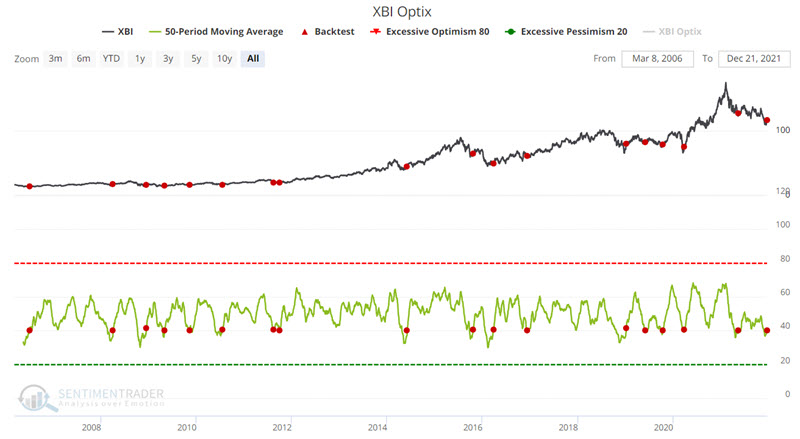
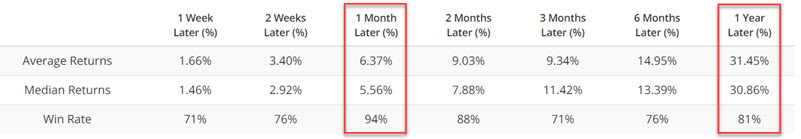
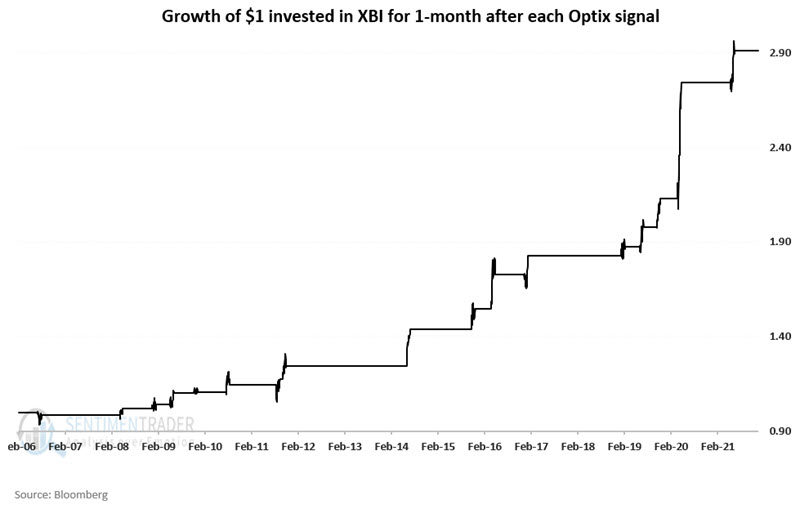
The summary of results for previous signals appears below. Over the next month, XBI rose 94% of the time, with a median return of +5.6%. Over the next year, it gained a median of 30.9%.
The chart below displays the growth of $1 invested in XBI for one month after each signal.
Going long via shares versus options
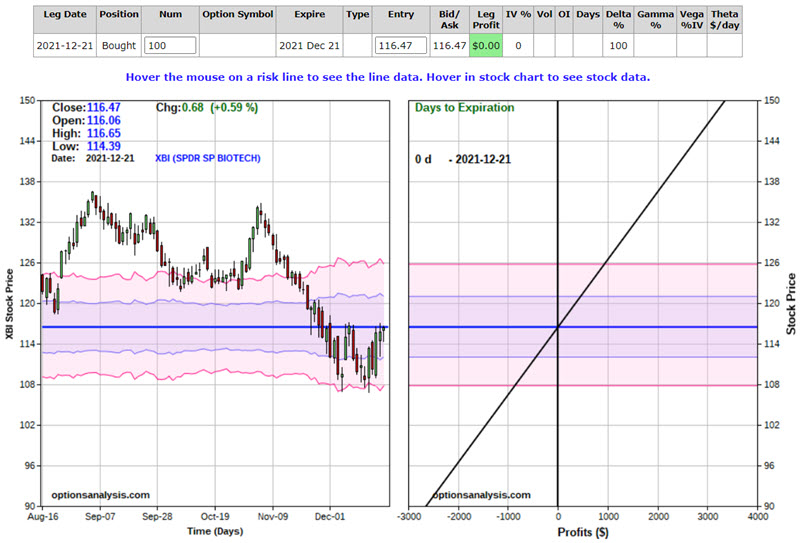
The most straightforward way to trade the latest Optix signal is to buy 100 shares of XBI and sell them one month (or twelve months) later. With XBI trading at $116.47 a share, this trade requires a capital commitment of $11,647. The risk curve for this position is a straight line and appears in the chart below (courtesy of Optionsanalysis). For each $1 in price XBI rise or falls, this position gains or loses $100.
One alternative to committing $11,000+ is to employ the stock replacement strategy using a call option on XBI.
One possibility is to buy one XBI Jan21 2022 100 strike price call option. This position costs $1,730 (assuming it was purchased at the bid/ask spread midprice at the close on 12/21) to enter instead of $11,647 for 100 shares. Because this position has a delta of 92, it will behave like a long 92 XBI shares position at a fraction of the cost. The particulars for this trade and the risk curves appear in the screenshots below.
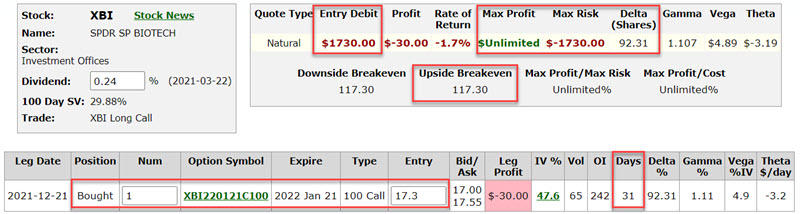
If XBI rises over the next month: Because the options trader pays a time premium, the breakeven price for this position is $117.30 a share for XBI. Above that price, the profit for the option position moves point-for-point with the stock position.
If XBI falls over the next month: If XBI fails to advance in price over the next month, the option position will lose money, and the option will expire on 1/21/2022. The worst-case scenario is if XBI falls below $100 a share, in which the option will expire worthless, and the maximum loss of -$1,730 will be realized.
One important trading note: If XBI is trading at any price above $100 a share at option expiration on 1/21/2022, the 100 strike price call will automatically be exercised, and the holder of a long 100 strike price call will be obligated to buy 100 shares of XBI at $100 a share. So if a trader does not want to purchase shares of XBI, they must remember to sell their call option before expiration.
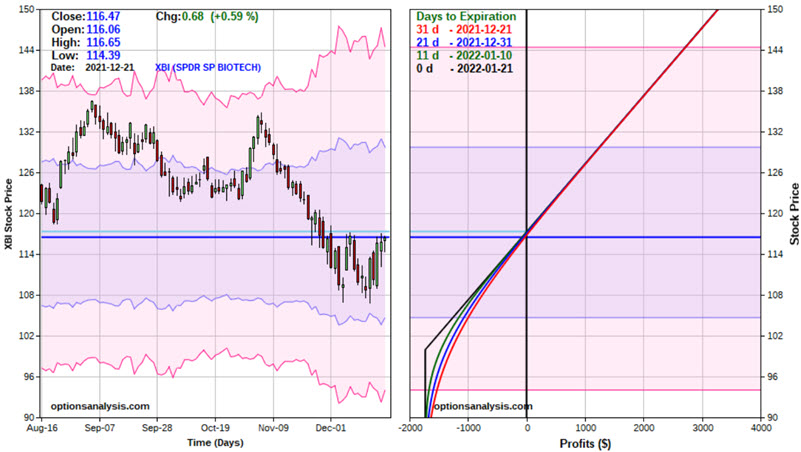
Finally, let's compare the two positions directly. The chart below displays the risk curves for both the long 100 shares of XBI and call option position overlaid on top of each other. The grey line represents the long 100 shares position, and the black line represents the 100 strike price call position.
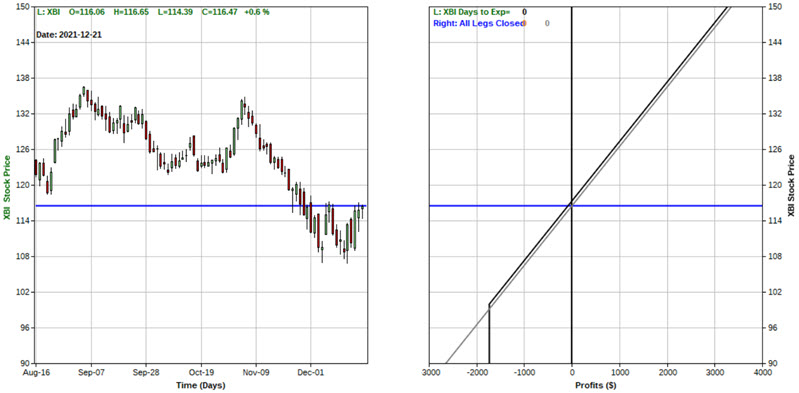
The advantages of the option position are:
- A commitment of only $1,730 instead of $11,647
- Point-for-point profit above $117.30 a share
- Limited risk on the downside
The primary advantage of buying shares is that a trader can hold them indefinitely, whereas the call option will expire in one month.
If XBI rose +5.56% in one month (the median 1-month return for all previous signals), the stock position would gain $647, or 5.6%, on an $11,647 commitment. But the option position would gain $564, or 32.6%, on a $1,730 commitment.
What the research tells us...
The 50-day Optix for ticker XBI just crossed above 40% for the first time in at least a month. Historically, this signal has consistently been followed by above-average one-month returns (for speculators) and sizeable 12-month returns (for investors). Past performance is never a guarantee of future results, so traders and investors should reasonably allocate capital if they choose to exploit this opportunity.