Data &
Technology
Research
Reports
Report Solutions
Reports Library
Actionable
Strategies
Free
Resources
Simple Backtest Calculator
Simple Seasonality Calculator
The Kelly Criterion Calculator
Sentiment Geo Map
Public Research Reports
Free Webinar
Pricing
Company
About
Meet Our Team
In the News
Testimonials
Client Success Stories
Contact
Log inLoginSign up
< BACK TO ALL REPORTS

S&P Nearing A New High On Nonfarm Payroll Day

Jason Goepfert
2016-07-08
null

There is a constantly changing dynamic in markets regarding whether good news should be taken as good news (growing economy) or bad news (Fed is more likely to hike). Just when traders think they have it figured out, sentiment changes.

Today the good news of better-than-expected payrolls is being taken as good news. Curiously, both stocks and bonds are being bought. Dating back to 1996, the only other time that the Nonfarm Payroll (NFP) report beat estimates and SPY and TLT both gained at least 0.5% on the day was March 4, 2005. For what it's worth, stocks peaked the next day and fell about 7% over the next two months.

There were 6 times that SPY gained at least 0.5% and TLT by any amount on a NFP beat and it led to short-term weakness 4 of the 6 times.

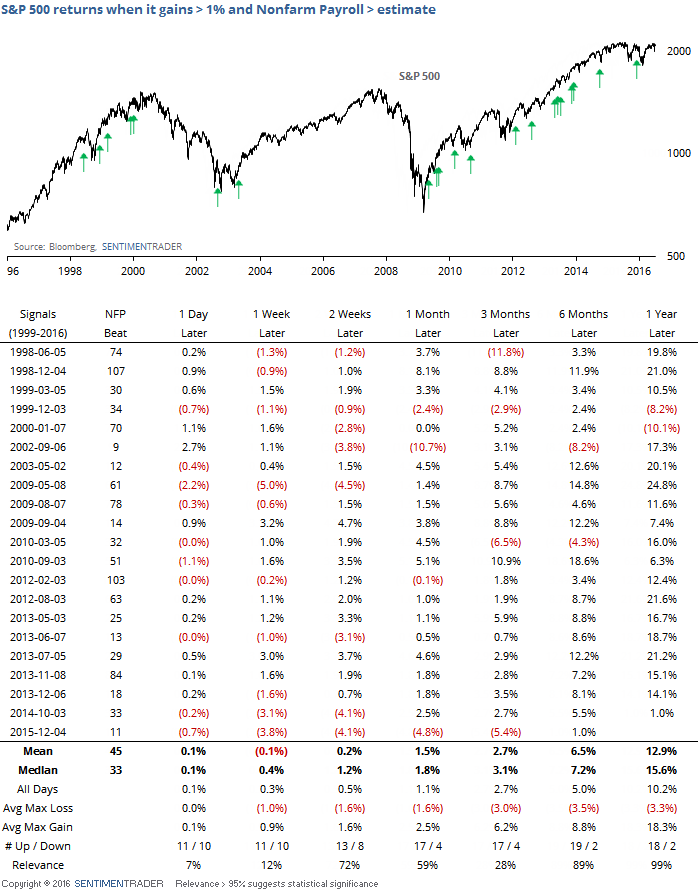
If we just focus on stocks, then there have been 21 times that SPY gained 1% or more on a NFP beat. As we've discussed often with large moves on a NFP day, there was often some give-back in the day(s) ahead. After these particular occurrences, there was a strong tendency to rise in the medium-term. We don't put a lot of weight on medium-term results stemming from one-day patterns, though.

20160708_payroll

If the S&P happens to close at a new high today, then it would mark the 16th time that it closed at a new 52-week high on a NFP beat. It continued to gain over the next three days after only 4 of the 15 prior occurrences.

If the S&P broke out to a multi-year high on any NFP day (whether it beat estimates or not), then it gained ground the next day 10 out of 31 times and up to a week later only 13 times.

Forgetting about economic reports, there have been 64 times since 1957 that the S&P 500 rose at least 1% on a Friday, to within 1% of a 52-week high. It continued to rally through Tuesday 42% of the time. Since 2000, that drops to 31% of the time, including 3 out of 9 times since the 2009 bottom.

Overall, behavior like today's (so far, anyway) would argue for some weakness early next week as the buying enthusiasm takes a breather. This will be especially interesting given the S&P's proximity to a new high. Half of traders will argue that it means we'll see a breakout and runaway rally, the other half will argue that it's resistance and we're about to top out. Judging from typical behavior, the most likely scenario would be a push to a new high that sucks in late buyers, then 1-3 days of backtracking that flushes some of those out.

In the medium-term, we're still focused on the positives that were indicated by the breadth thrust last week and nothing since then has caused much of a worry that that's wrong-headed.

Sorry, you don't have access to this report

Upgrade your subscription plan to get access
Go to Dasboard
DATA &
TECHnologies
IndicatorEdge
‍
BackTestEdge
‍
Other Tools
‍
DataEdge API
RESEARCH
reports
Research Solution
‍
Reports Library
‍
actionable
Strategies
Trading Strategies
‍
Smart Stock Scanner
‍
FREE
RESOUrCES
Simple Backtest
Calculator
Simple Seasonality
Calculator
The Kelly Criterion
Calculator
Sentiment Geo Map
‍
Public Research Reports
‍
Free Webinar
COMPANY
‍
About
‍
Meet our Team
‍
In the News
‍
Testimonials
‍
Client Success Stories
Pricing
Bundle pricing
‍
Announcements
‍
FAQ
© 2024 Sundial Capital Research Inc. All rights reserved.
Setsail Marketing
TermsPrivacyAffiliate Program
Risk Disclosure: Futures and forex trading contains substantial risk and is not for every investor. An investor could potentially lose all or more than the initial investment. Risk capital is money that can be lost without jeopardizing ones’ financial security or life style. Only risk capital should be used for trading and only those with sufficient risk capital should consider trading. Past performance is not necessarily indicative of future results.

Hypothetical Performance Disclosure: Hypothetical performance results have many inherent limitations, some of which are described below. No representation is being made that any account will or is likely to achieve profits or losses similar to those shown; in fact, there are frequently sharp differences between hypothetical performance results and the actual results subsequently achieved by any particular trading program. One of the limitations of hypothetical performance results is that they are generally prepared with the benefit of hindsight. In addition, hypothetical trading does not involve financial risk, and no hypothetical trading record can completely account for the impact of financial risk of actual trading. for example, the ability to withstand losses or to adhere to a particular trading program in spite of trading losses are material points which can also adversely affect actual trading results. There are numerous other factors related to the markets in general or to the implementation of any specific trading program which cannot be fully accounted for in the preparation of hypothetical performance results and all which can adversely affect trading results.

Testimonial Disclosure: Testimonials appearing on this website may not be representative of other clients or customers and is not a guarantee of future performance or success.