Data &
Technology
Research
Reports
Report Solutions
Reports Library
Actionable
Strategies
Free
Resources
Simple Backtest Calculator
Simple Seasonality Calculator
The Kelly Criterion Calculator
Sentiment Geo Map
Public Research Reports
Free Webinar
Pricing
Company
About
Meet Our Team
In the News
Testimonials
Client Success Stories
Contact
Log inLoginSign up
< BACK TO ALL REPORTS

S&P approaching all time highs

Troy Bombardia
2020-08-06
The past few weeks and months have seen U.S. tech stocks rally relentlessly while other countries' stock indices bounced sideways. The tech rally managed to drag the S&P 500 towards all-time highs, which is quite amazing given all the doomsday predictions we saw in late-March.

NOTE: I (Jason) am dealing with some family health issues, so I'm re-publishing Troy's note with some quick notes from myself, noted with [Jason]

The past few weeks and months have seen U.S. tech stocks rally relentlessly while other countries' stock indices bounced sideways. The tech rally managed to drag the S&P 500 towards all-time highs, which is quite amazing given all the doomsday predictions we saw in late-March.


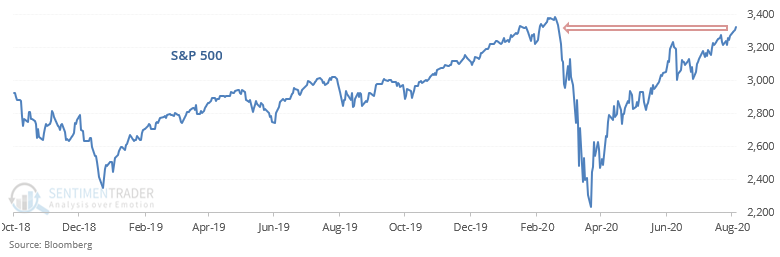
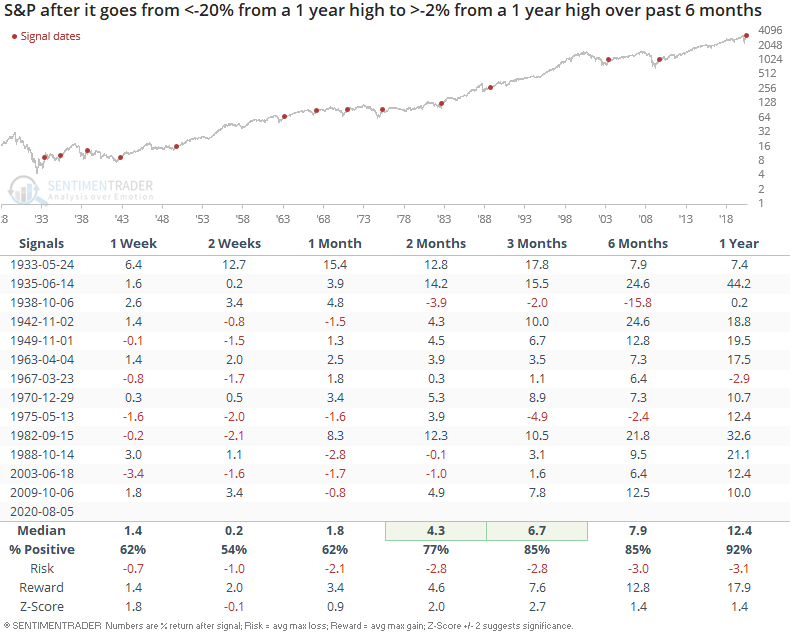
The S&P is now less than -2% from its all-time high. When the S&P cycled from bear market territory to within -2% of a 1 year high, the S&P usually trended higher over the next 2+ months:

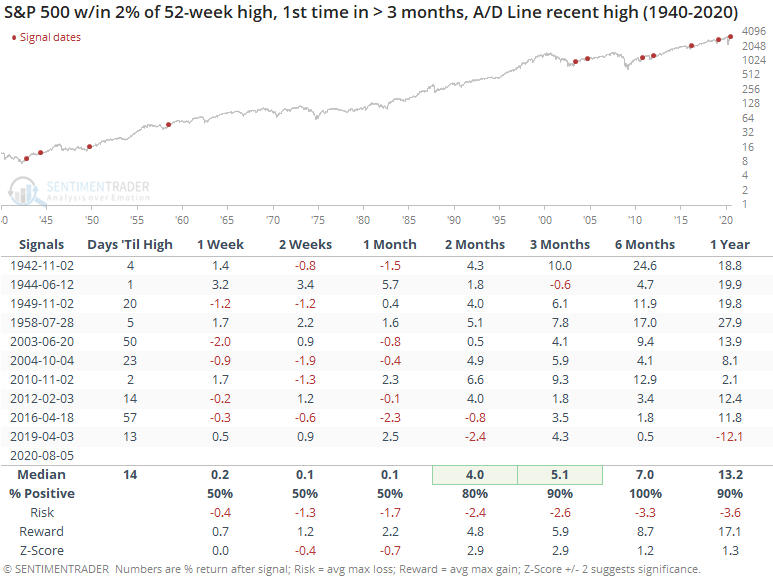
[Jason]: We also know that the Advance/Decline Line is hitting new highs, suggesting a broad rally. That isn't really the case, and we're still seeing a somewhat poor environment coupled with high optimism, but the recent run has been persistent enough that even though (relatively) few securities are advancing, they've been advancing long enough that the line is hitting new highs. When we see that in combination with the S&P approaching its prior highs, the S&P has always been able to eclipse its prior high within 60 days, usually much quicker. How do we square that with the negatives that have cropped up over the past 1-2 months? I don't think we can, we just need to weigh which is more important. So far, momentum has clearly been winning out, even if the rally has tapered off some. Given the environment/sentiment combination in recent weeks, it still seems likely that reward should be limited, with a high probability that the gains will be given back at some point in the coming months.

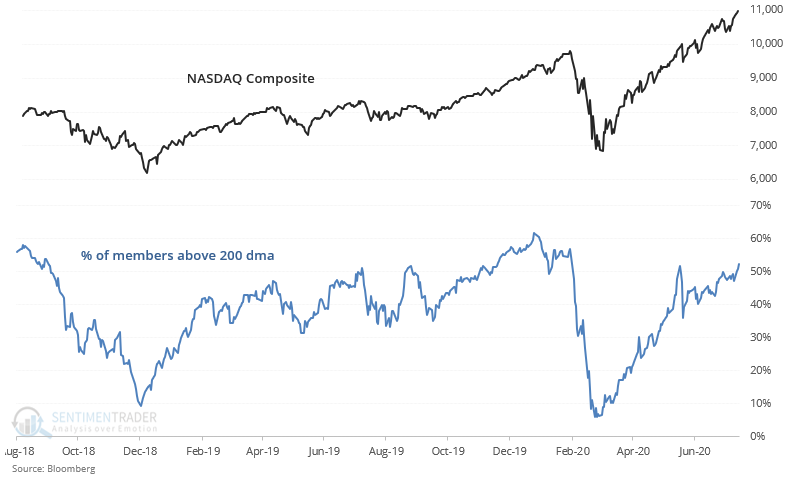
One of the big complaints during the entire course of this rally is "weak breadth". Breath is still weak, but at least for the NASDAQ Composite is ever so slightly improving. 52% of the NASDAQ Composite's members are now above their 200 dma:

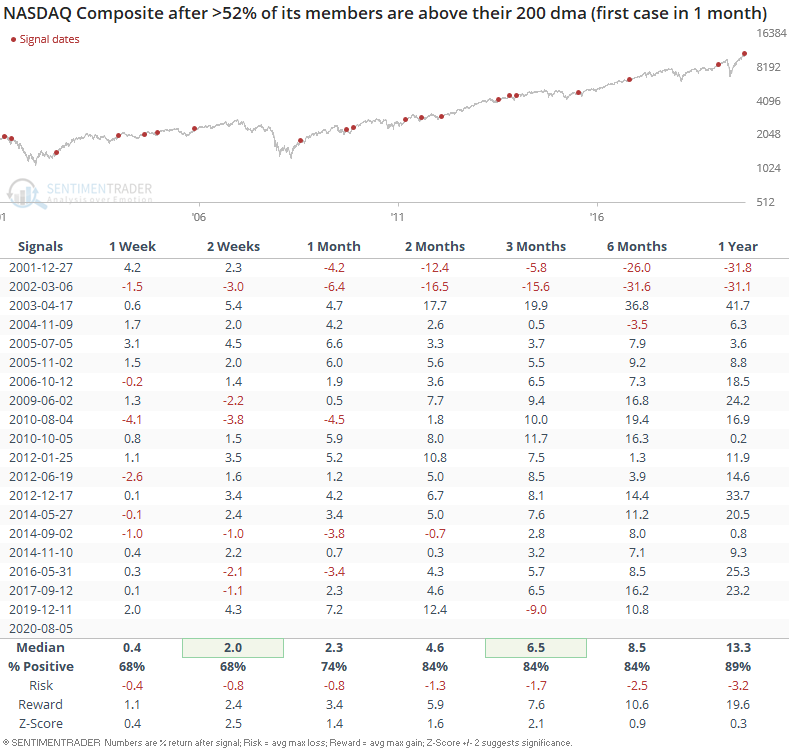
When this happened in the past, the NASDAQ Composite usually rallied over the next 3 months:

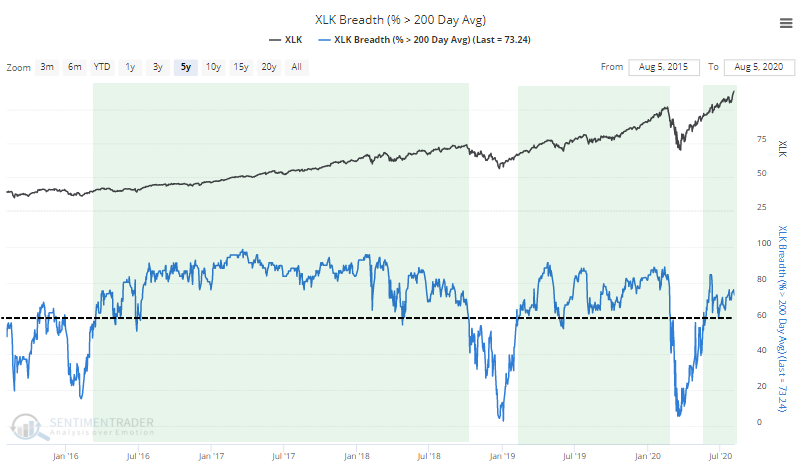
[Jason]: Unlike what we're seeing within the S&P 500 (and industries, sectors, and countries), more than 60% of stocks in the S&P tech sector have consistently been holding above their 200-day moving averages. This is a hallmark of healthy markets, so for this sector, anyway, it's bucking the broader environment.

Sorry, you don't have access to this report

Upgrade your subscription plan to get access
Go to Dasboard
DATA &
TECHnologies
IndicatorEdge
‍
BackTestEdge
‍
Other Tools
‍
DataEdge API
RESEARCH
reports
Research Solution
‍
Reports Library
‍
actionable
Strategies
Trading Strategies
‍
Smart Stock Scanner
‍
FREE
RESOUrCES
Simple Backtest
Calculator
Simple Seasonality
Calculator
The Kelly Criterion
Calculator
Sentiment Geo Map
‍
Public Research Reports
‍
Free Webinar
COMPANY
‍
About
‍
Meet our Team
‍
In the News
‍
Testimonials
‍
Client Success Stories
Pricing
Bundle pricing
‍
Announcements
‍
FAQ
© 2024 Sundial Capital Research Inc. All rights reserved.
Setsail Marketing
TermsPrivacyAffiliate Program
Risk Disclosure: Futures and forex trading contains substantial risk and is not for every investor. An investor could potentially lose all or more than the initial investment. Risk capital is money that can be lost without jeopardizing ones’ financial security or life style. Only risk capital should be used for trading and only those with sufficient risk capital should consider trading. Past performance is not necessarily indicative of future results.

Hypothetical Performance Disclosure: Hypothetical performance results have many inherent limitations, some of which are described below. No representation is being made that any account will or is likely to achieve profits or losses similar to those shown; in fact, there are frequently sharp differences between hypothetical performance results and the actual results subsequently achieved by any particular trading program. One of the limitations of hypothetical performance results is that they are generally prepared with the benefit of hindsight. In addition, hypothetical trading does not involve financial risk, and no hypothetical trading record can completely account for the impact of financial risk of actual trading. for example, the ability to withstand losses or to adhere to a particular trading program in spite of trading losses are material points which can also adversely affect actual trading results. There are numerous other factors related to the markets in general or to the implementation of any specific trading program which cannot be fully accounted for in the preparation of hypothetical performance results and all which can adversely affect trading results.

Testimonial Disclosure: Testimonials appearing on this website may not be representative of other clients or customers and is not a guarantee of future performance or success.