
S&P 500 Power Period #1

CORRECTION: In the original version of this article, the starting and ending dates of the period being examined was listed as:
- The close on 10/26/2021
- The close on 11/2/2021
Those lines should have read:
- The close on 10/27/2021 (the 3rd to last close of October)
- The close on 11/3/2021 (the close on the 3rd trading day in November)
For the record, "Yes," I am aware that phrases like "Power Period" are kind of hokey and borderline sensationalistic. But still, as a title, I think it has a little more pizzazz than the alternative, which is "A Period When the S&P 500 Has Gone Up 75% of the Time."
POWER PERIOD #1
The period we will examine is the 5-trading day period that extends:
- From the close of the 3rd to the last trading day of October
- Through the close on the 3rd trading day of November
In plain English, we are talking about being long the S&P 500 Index during the last 2 trading days of October plus the first 3 trading days of November.
For 2021, this period will extend from:
- The close on 10/27/2021
- Through the close on 11/3/2021
THE HISTORY
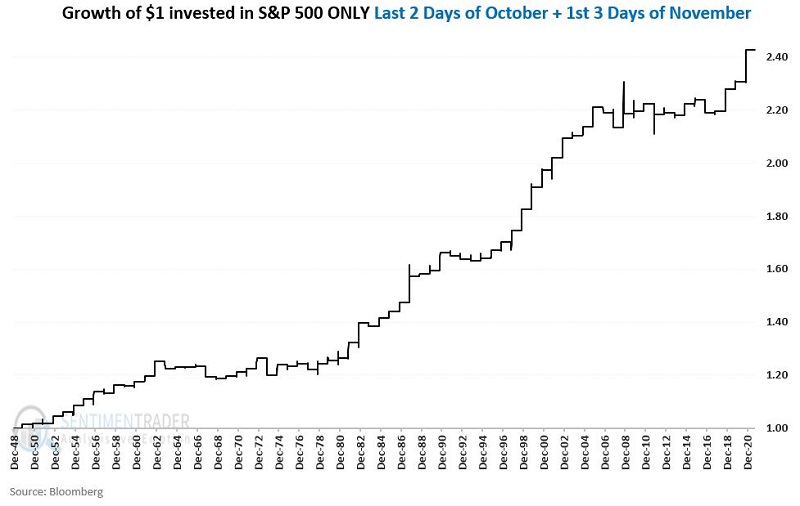
The chart below displays the cumulative growth of $1 invested in the S&P 500 Index (price-performance only) every year during the 5-day period described above, starting in 1949.
THE RESULTS
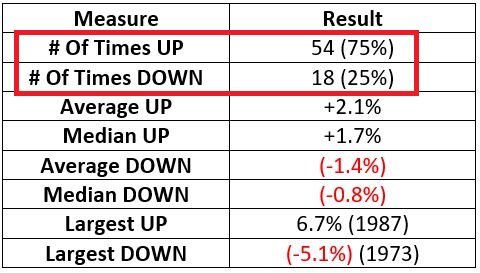
The table below displays the results of this test.
SUMMARY
Is the S&P 500 Index (and attendant index funds) certain to trade higher during this 5 trading day period in 2021? Of course not. There are no "sure things" in the financial markets, and 2021 could easily be one of those "off years."
At the same time:
- A 75% Win Rate
- Combined with an Average Win/Average Loss ratio of almost 1.5-to-1
- Over a 72-year span
- Offers an "edge" that some traders may find compelling