
S&P 500 Equal-Weight vs. Cap-Weight Rotation Timing System

I've shared several relative ratio concepts over the last six months that use a systematic approach to identifying key inflection points for the broad market. The goal of today's note is to review a relative ratio timing system for the equal versus cap-weighted S&P 500 Index.
RELATIVE RATIO RANGE CONCEPT
The concept I use to identify relative ratio range signals is simple. I calculate the ratio for two securities and measure the range over a lookback period in percentage terms. The range rank methodology allows one to test threshold levels between 0 and 100% for signals in an optimization process.
RELATIVE RATIO SYSTEM
The system is always in the market. Depending on the most recent signal, the system will take a position in either the equal or cap-weighted S&P 500 index.
PARAMETERS AND CONDITIONS FOR SIGNALS
Relative Ratio = SPXE/SPX. The range rank for the relative ratio utilizes a 105-day lookback period.
- If the relative ratio range crosses above the 96th percentile, buy the equal-weighted index
- If the relative ratio range crosses below the 5th percentile, buy the cap-weighted index
So, the equal-weight signal triggers when the rank was in the upper 96% of its range over the past 105 days. Conversely, the cap-weighted index signals an alert when the rank is in the lower 5%.
Let's take a look at the current chart and historical signal performance.
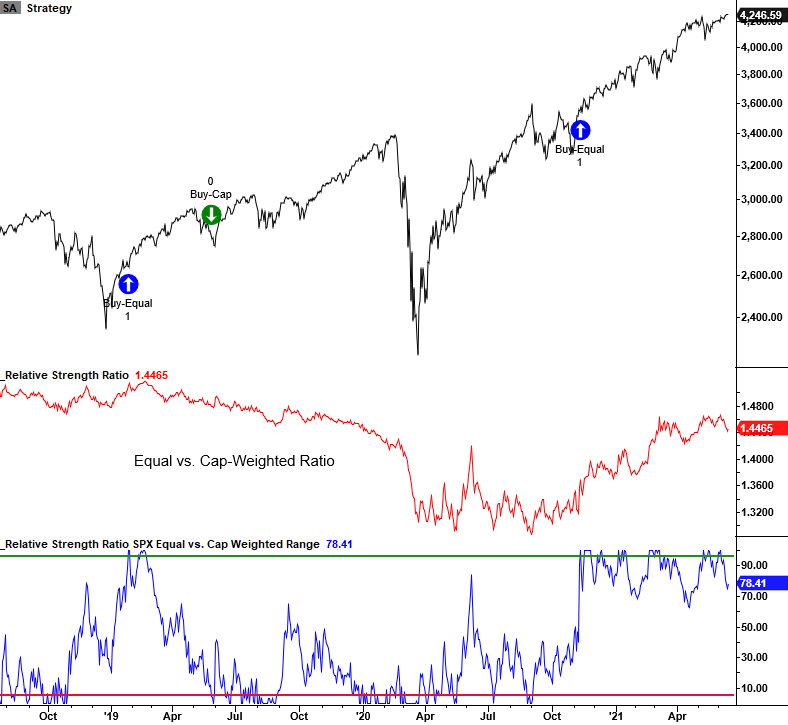
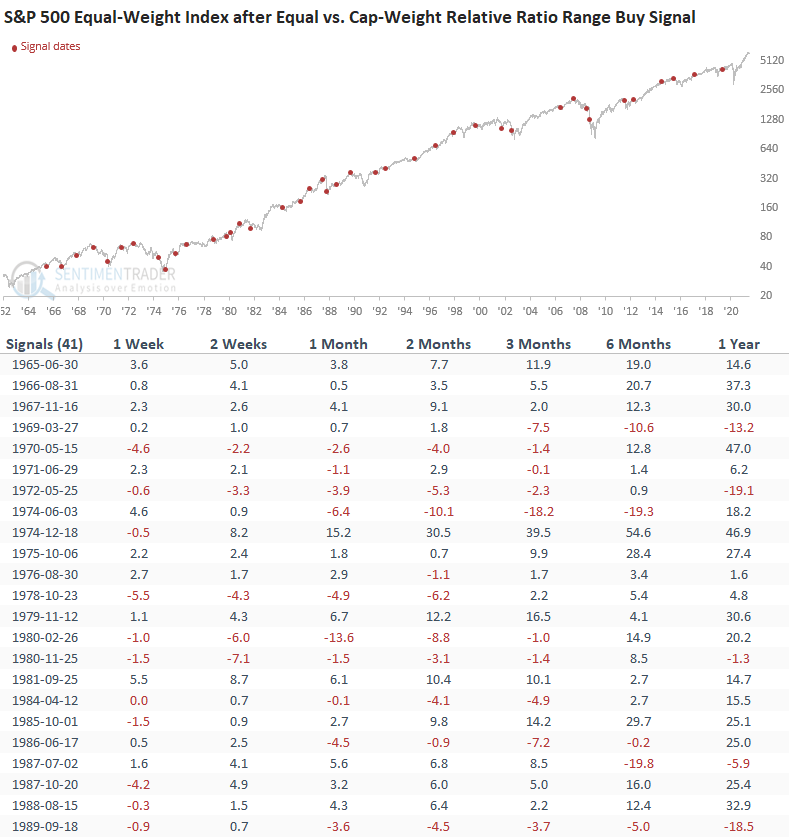
CURRENT DAY CHART
Typically, the system would initiate a signal to buy the equal-weighted index at a level near a meaningful low like the signal in 2019. However, due to significant economic uncertainty from the pandemic, investors remained in the safer cap-weighted index for a more extended period off the lows.
HISTORICAL PERSPECTIVE
The equal-weighted index has a perfect record of outperforming the cap-weighted version after a bear market. This is a big reason why I created a timing system for the two index weighting methodologies.
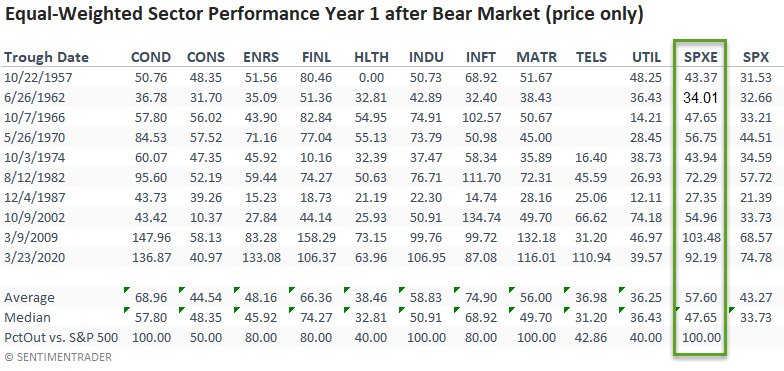
Let's now take a look at the performance of both signals and apply them to the equal and cap-weighted price-only data.
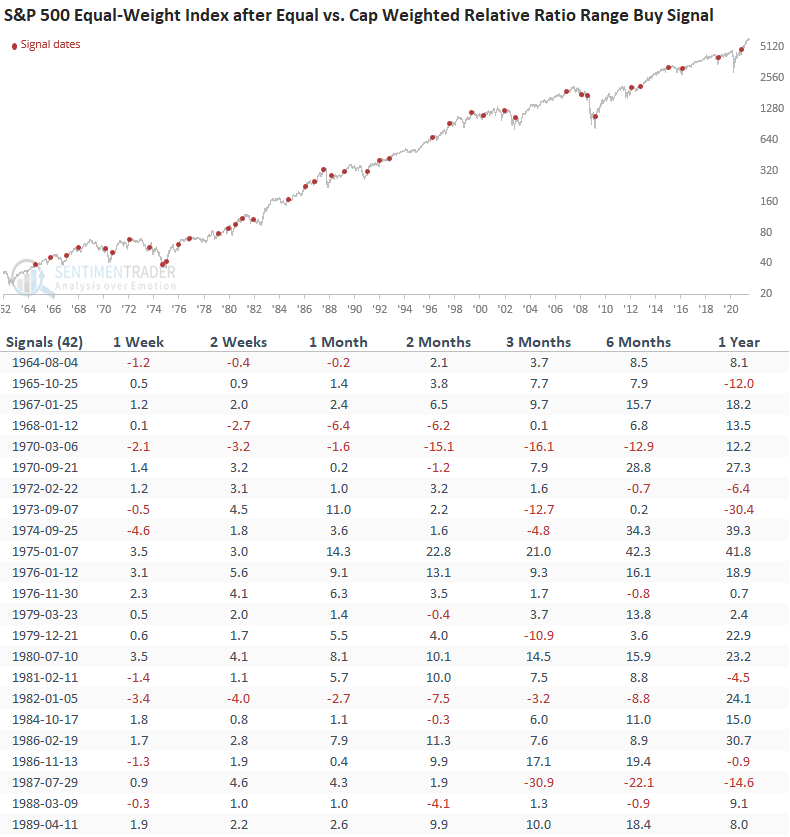
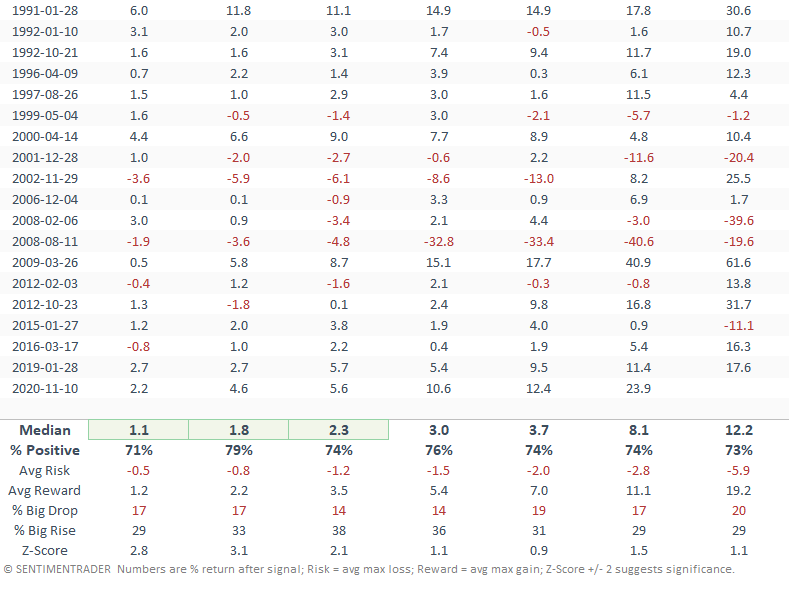
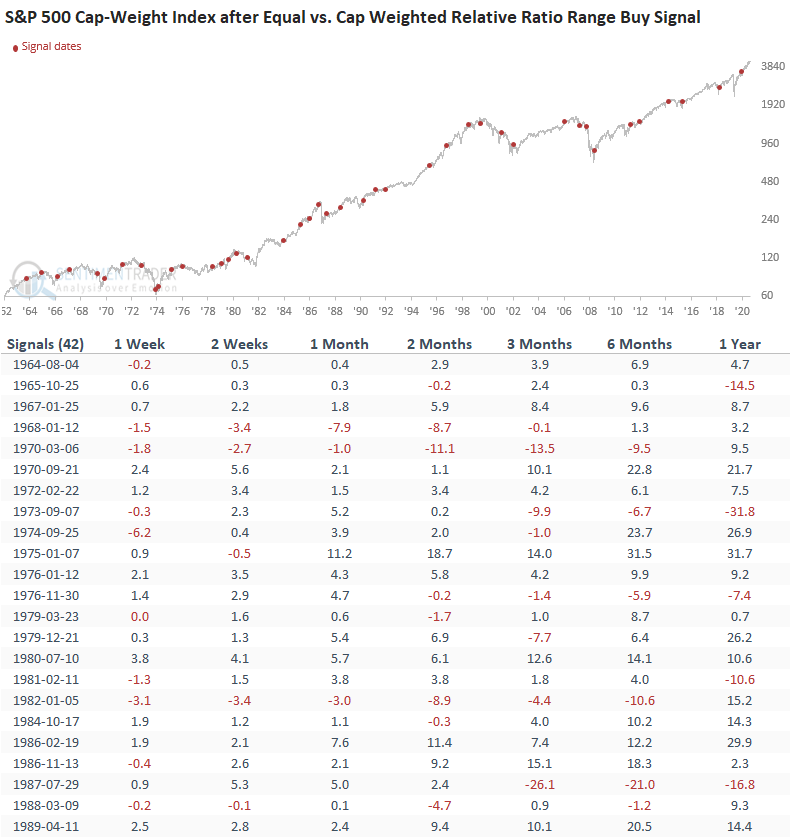
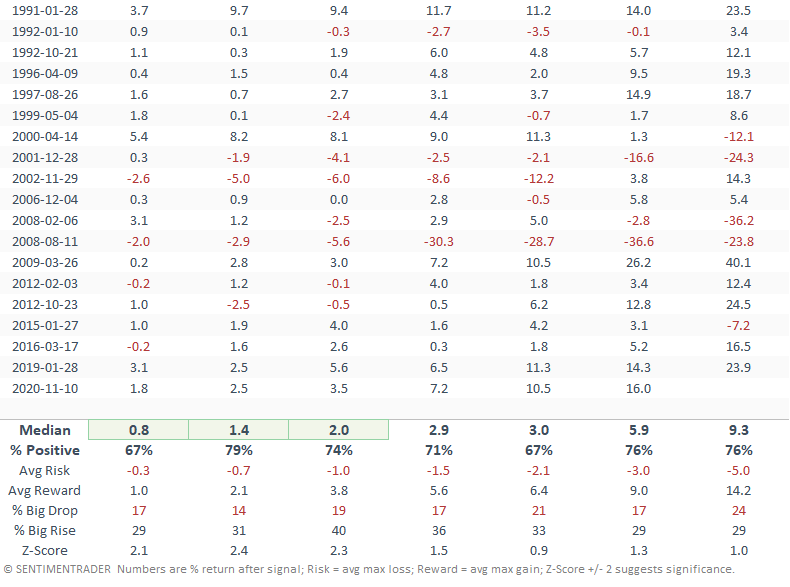
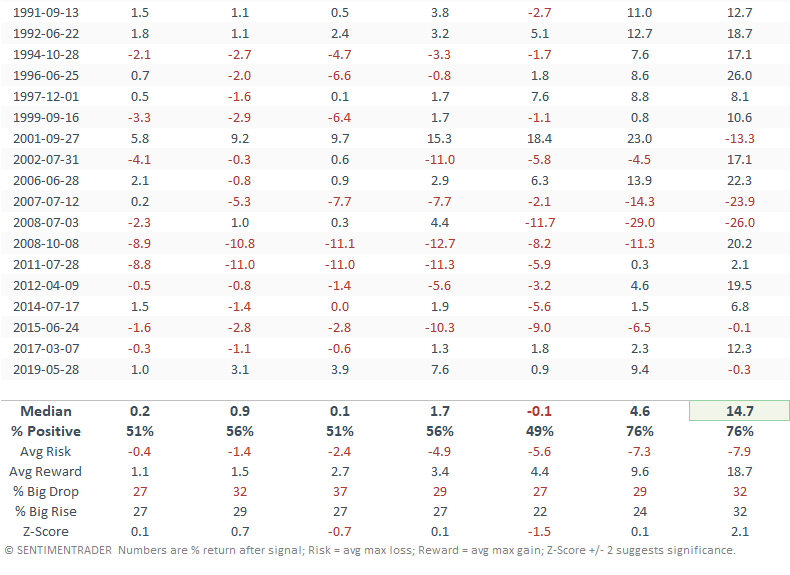
HOW THE SIGNALS PERFORMED - BUY SIGNAL FOR EQUAL-WEIGHT (EQUAL PRICE DATA)
Signal performance looks good, especially in the short term. I would note that several timeframes showed notable z-scores.
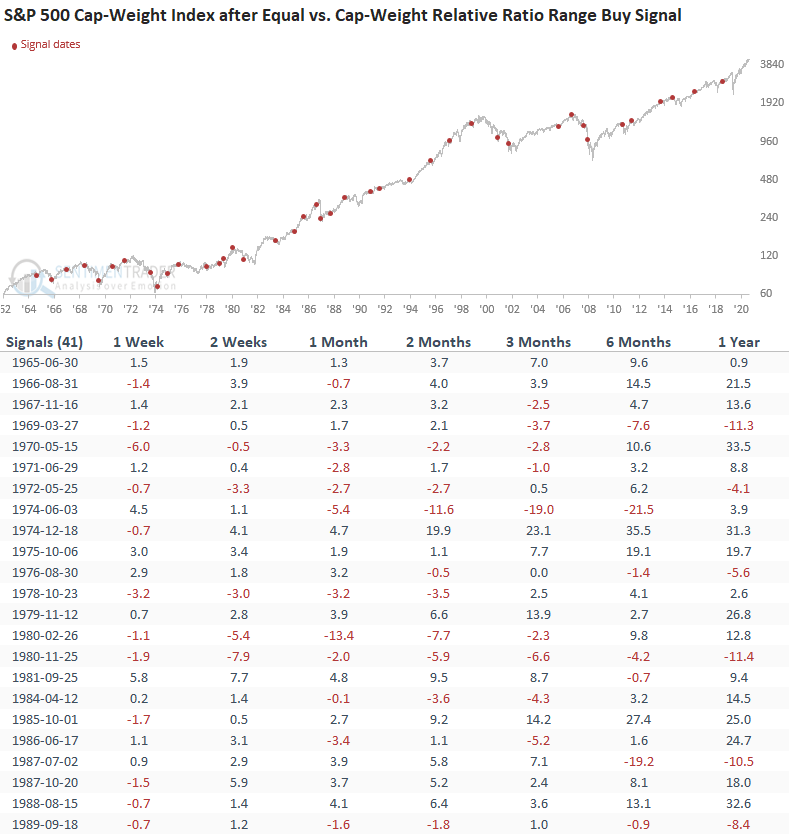
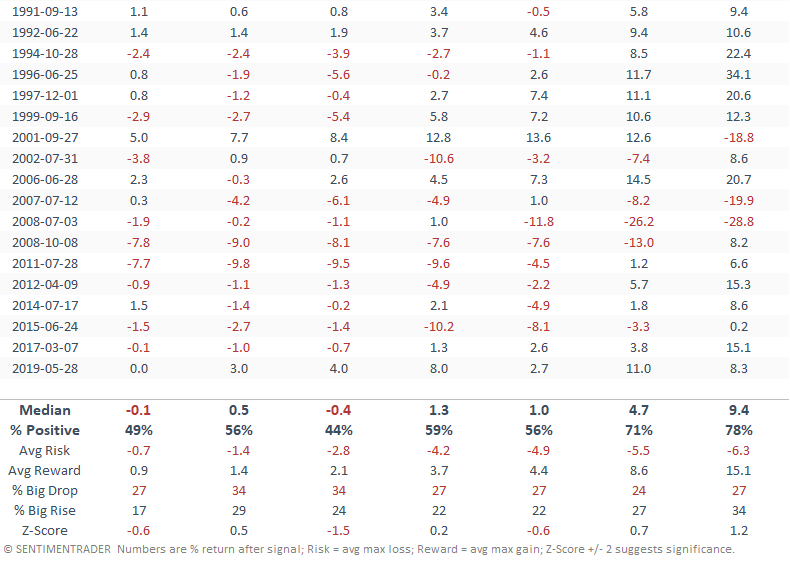
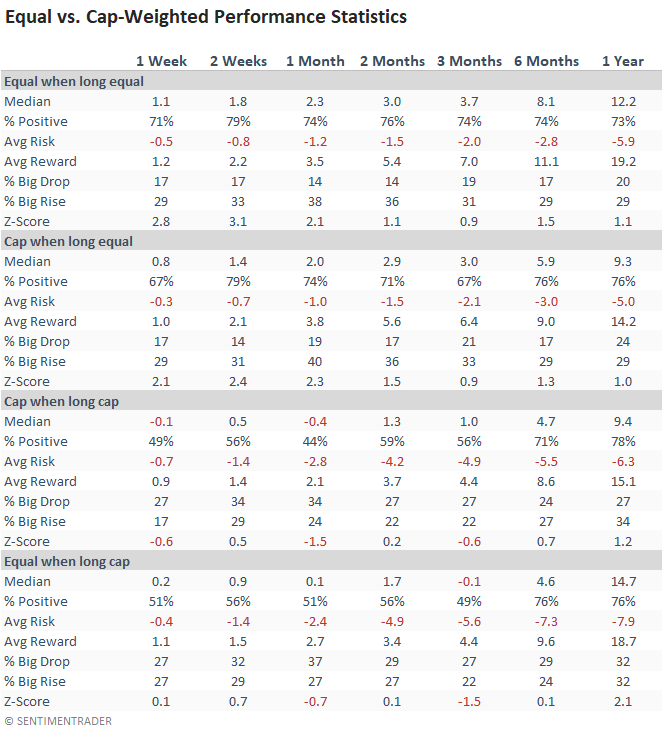
HOW THE SIGNALS PERFORMED - BUY SIGNAL FOR EQUAL-WEIGHT (CAP PRICE DATA)
Signal performance looks good, especially in the short term. However, I would note that the median returns for the equal-weighted index were better than the cap-weighted returns on all timeframes. It would appear that a surge in the relative ratio that favors the equal-weighted index is a positive development for the broad market, regardless of the weighting methodology.
HOW THE SIGNALS PERFORMED - BUY SIGNAL FOR CAP-WEIGHT (CAP PRICE DATA)
When the relative ratio system signals that one should buy the cap-weighted index, returns are significantly worse on a short to intermediate-term basis.
HOW THE SIGNALS PERFORMED - BUY SIGNAL FOR CAP-WEIGHT (EQUAL PRICE DATA)
When I apply the signals to the equal-weighted price-only data, the message is the same. Returns are weak on a short to intermediate-term basis.
SUMMARY OF SIGNAL PERFORMANCE
The relative ratio is a non-traditional way of measuring market participation. When the equal-weighted vs. cap-weighted ratio is rising, market breadth is in gear as more members within the index participate and influence performance. Conversely, when the equal-weighted vs. cap-weighted ratio is falling, market breadth is out of gear as fewer members within the index influence performance.
While the equal vs. cap-weighted relative ratio range has weakened of late, the indicator remains well above the signal threshold level. If a signal occurs, one should be aware that forward returns could potentially be unfavorable.