
S&P 500 Equal-Weight vs. Cap-Weight Relative Ratio Reversal

Each Monday, I provide an update on what I'm seeing with my absolute and relative trend indicators. One of the indicators in the ETF tables measures the consecutive number of days above or below the 10-day moving average. The indicator provides a perspective on short-term price momentum.
One can also apply the consecutive days above or below the 10-day moving average to the ratio of two securities. In this case, we would measure how one security compares to another for a perspective on relative momentum.
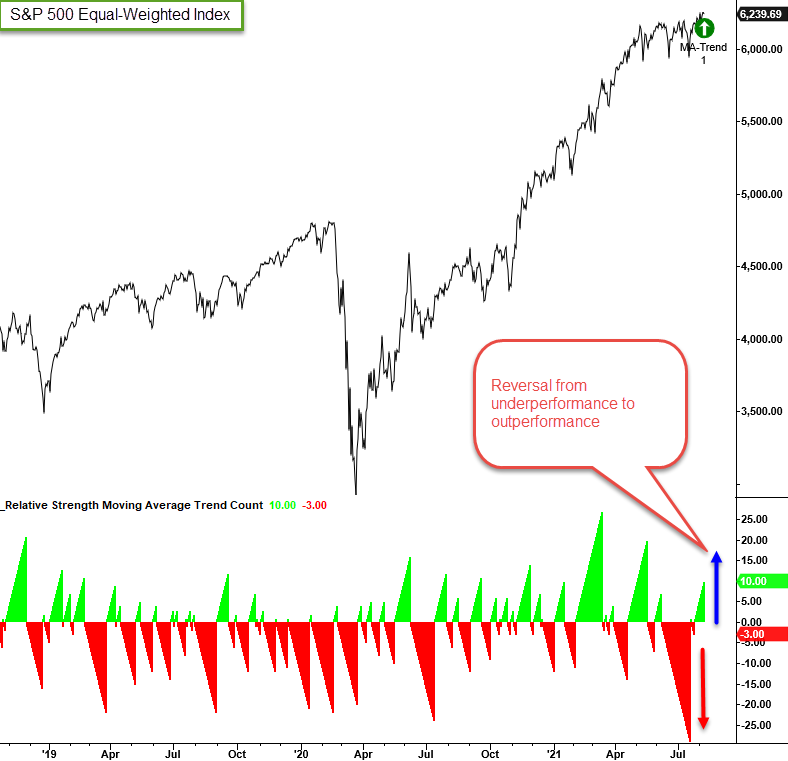
The ratio between the S&P 500 equal and cap-weighted index is a closely followed indicator. It provides a perspective on whether the troops or the generals are leading. When the ratio is rising, the average stock is participating. Conversely, when the ratio falls, participation is narrow. i.e., the generals are influencing index performance to a greater degree.
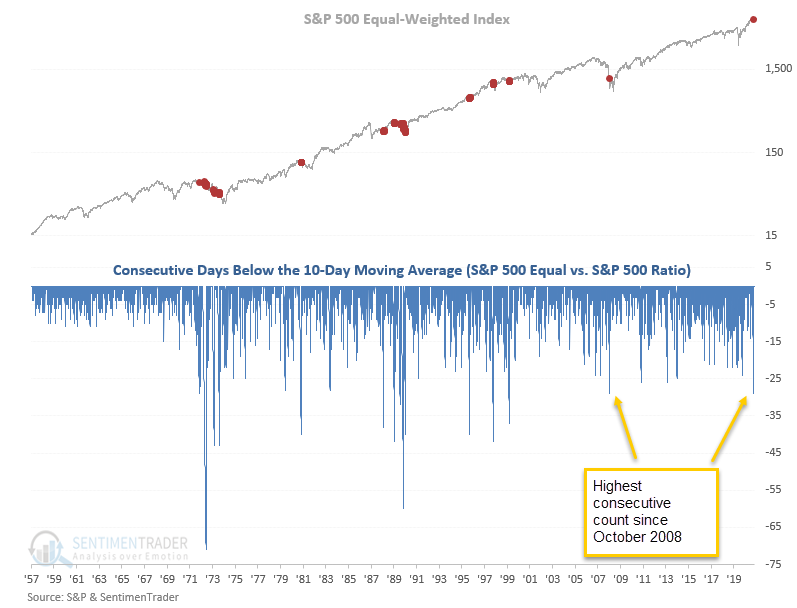
The relative ratio for the equal vs. cap-weighted S&P 500 index has now traded above the 10-day moving average for ten consecutive days. A ten-day count is pretty common. However, suppose we assess the conditions before the current winning streak. In that case, we see that the 10-day count reached 29 consecutive days below the average. If you were wondering, that's the longest streak below the average since October 2008.
Let's conduct a study to assess the forward return outlook for S&P 500 under the following conditions.
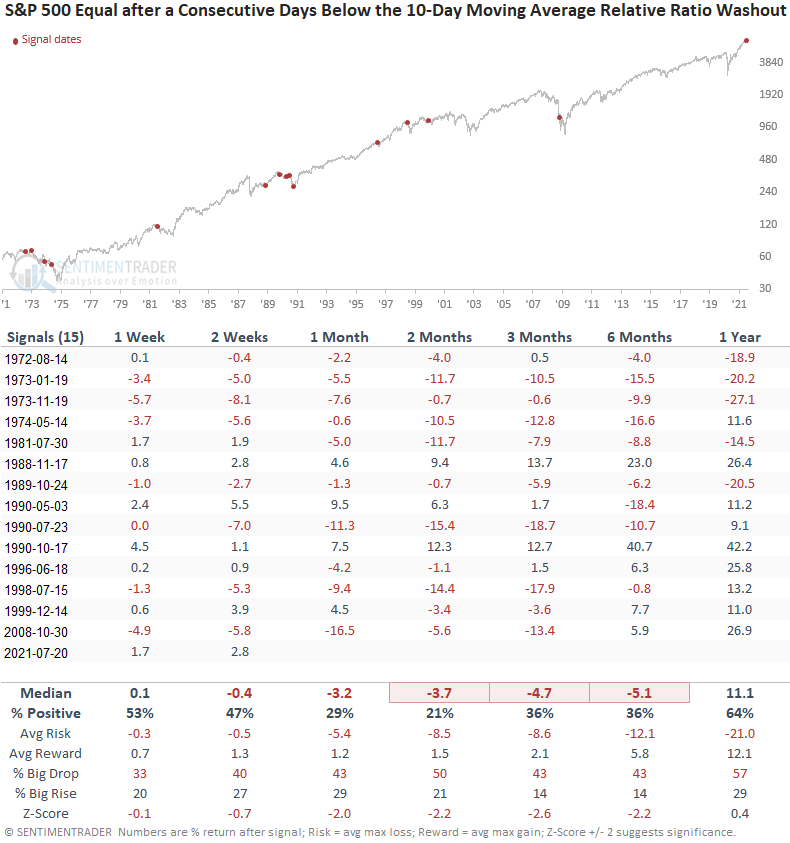
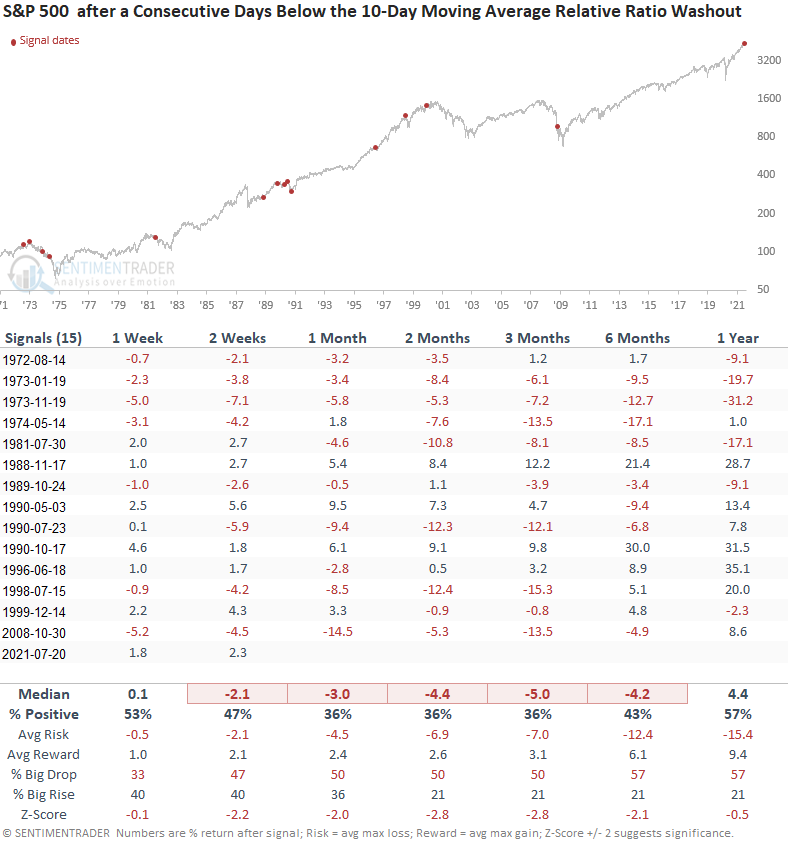
- The consecutive days below the 10-day average count for the relative ratio gets to 29 days.
- The consecutive days above the 10-day average count for the relative ratio gets to 10 days after the days below count resets at 29 days. i.e., the current scenario.
CURRENT DAY CHART
HISTORICAL CHART
As the chart shows, it's highly unusual to see the days below count reach a level of 29 outside of a bear market environment.
If you were wondering, I plot the days below count as a negative value in case I ever want to display the days above count in the same chart.
HOW THE SIGNALS PERFORMED - EQUAL-WEIGHT
Results for the S&P 500 equal-weighted index when the consecutive days below the moving average gets to 29 days looks weak across almost all timeframes. Typically, the signal dates reflect bear market environments or periods preceding a bear market.
HOW THE SIGNALS PERFORMED - CAP-WEIGHT
As expected, the S&P 500 performance looks weak across almost all timeframes.
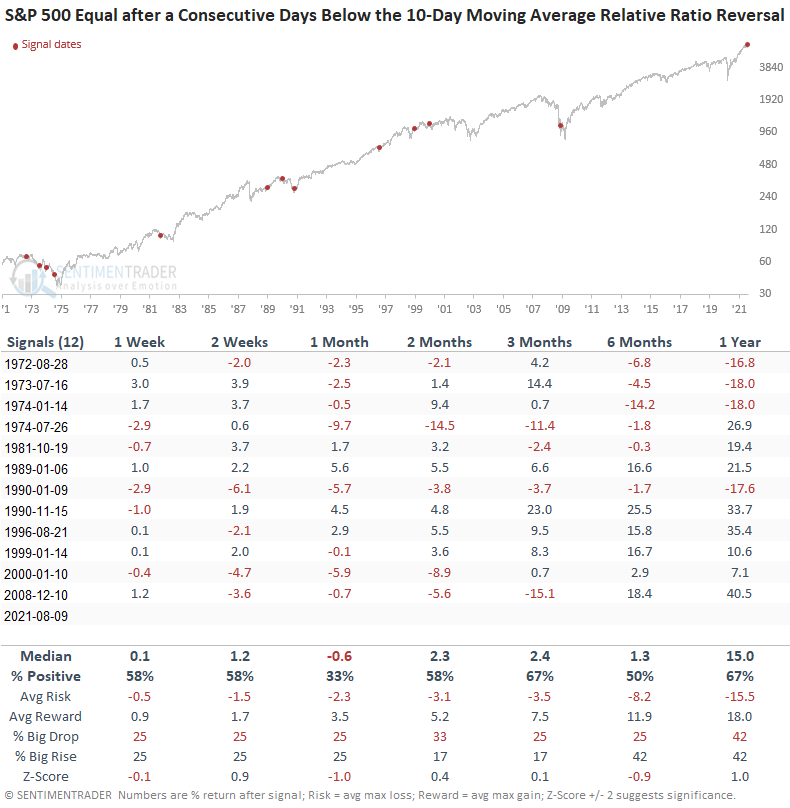
Now, let's assess what happens when the days above count hits ten after the days below count resets at 29 days. i.e., a reversal in the relative ratio count trend.
HOW THE SIGNALS PERFORMED - EQUAL-WEIGHT
Besides the 1-month timeframe, results are better when one waits for a reversal in relative momentum. However, I don't see anything that gets me excited.
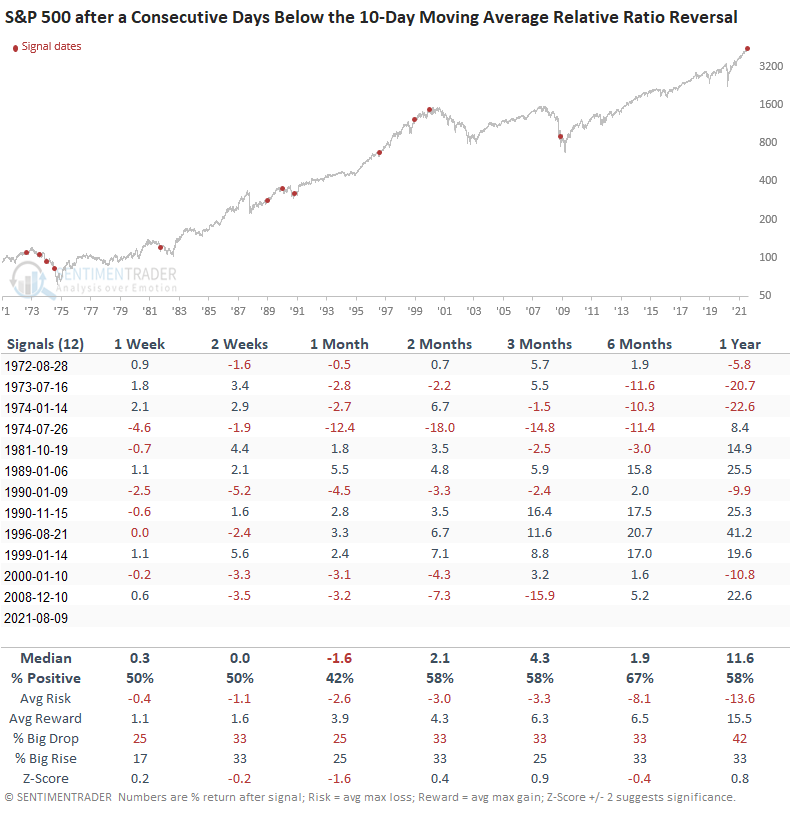
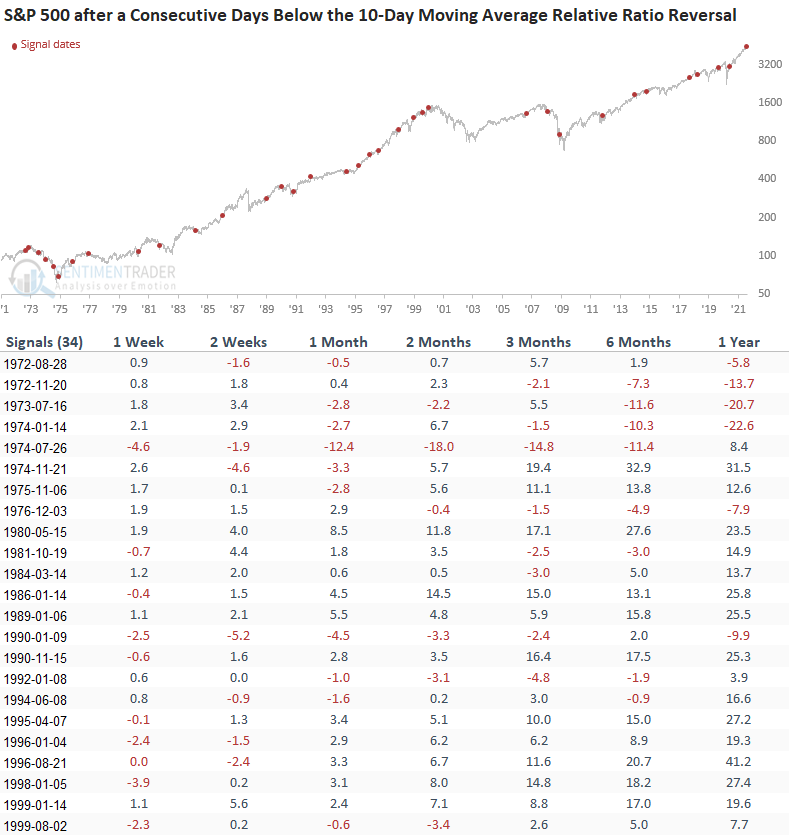
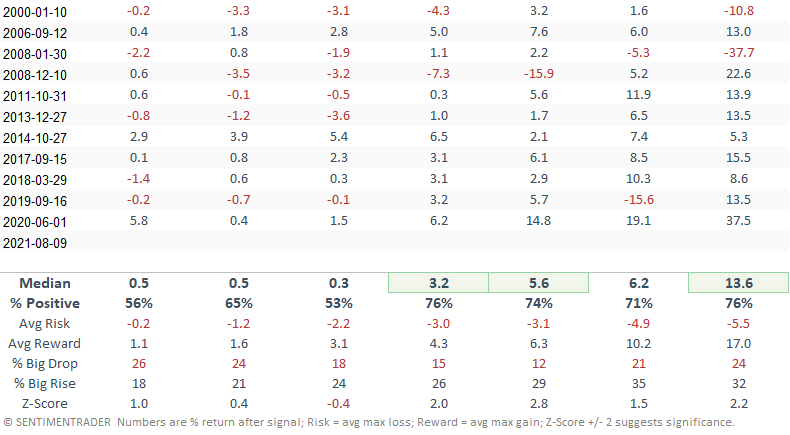
HOW THE SIGNALS PERFORMED - CAP-WEIGHT
Results look similar to the equal-weighted data. i.e., lackluster
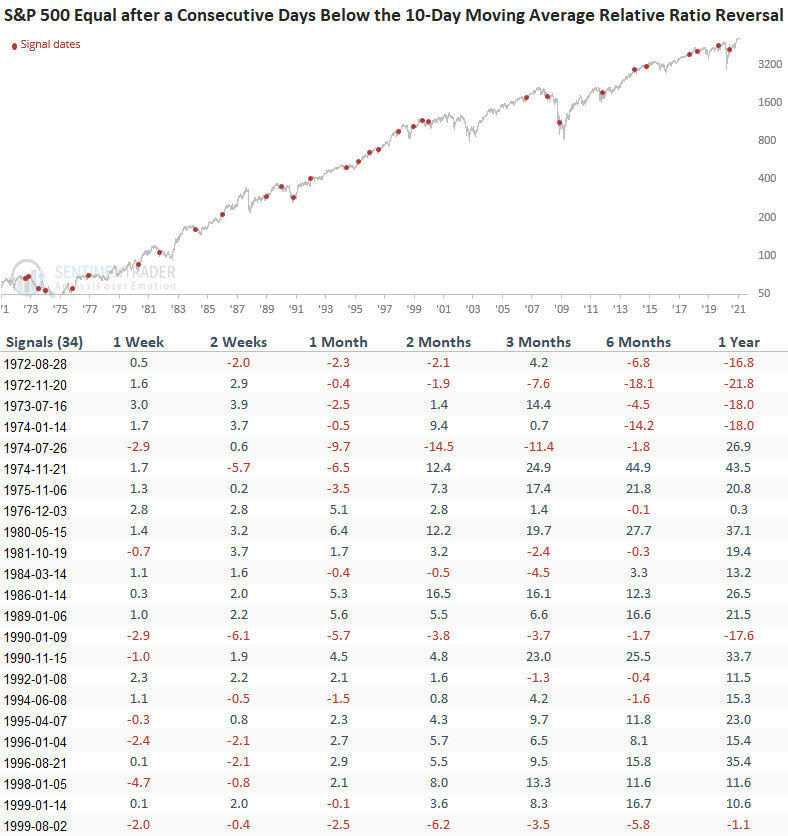
Let's lower the reset threshold to 20 consecutive days below the moving average and keep the ten-day count above condition to assess more instances.
HOW THE SIGNALS PERFORMED - EQUAL-WEIGHT
Besides the 1-month timeframe, results look much better.
HOW THE SIGNALS PERFORMED - CAP-WEIGHT
Results look slightly mixed to weak in the short term. I like the performance and risk/reward profile starting in the 2-month window.
Today's study once again emphasizes the unusual nature of the current bull market environment.