
S&P 500 corrections and possible paths

Key points:
- The S&P 500 fell into what is widely considered a correction, and relatively quickly
- When corrections do not morph into bear markets, there tends to be almost no further downside from the correction point
- Correlations to the past year's price action lightly suggest a benign outcome
Flirting with a semantic correction
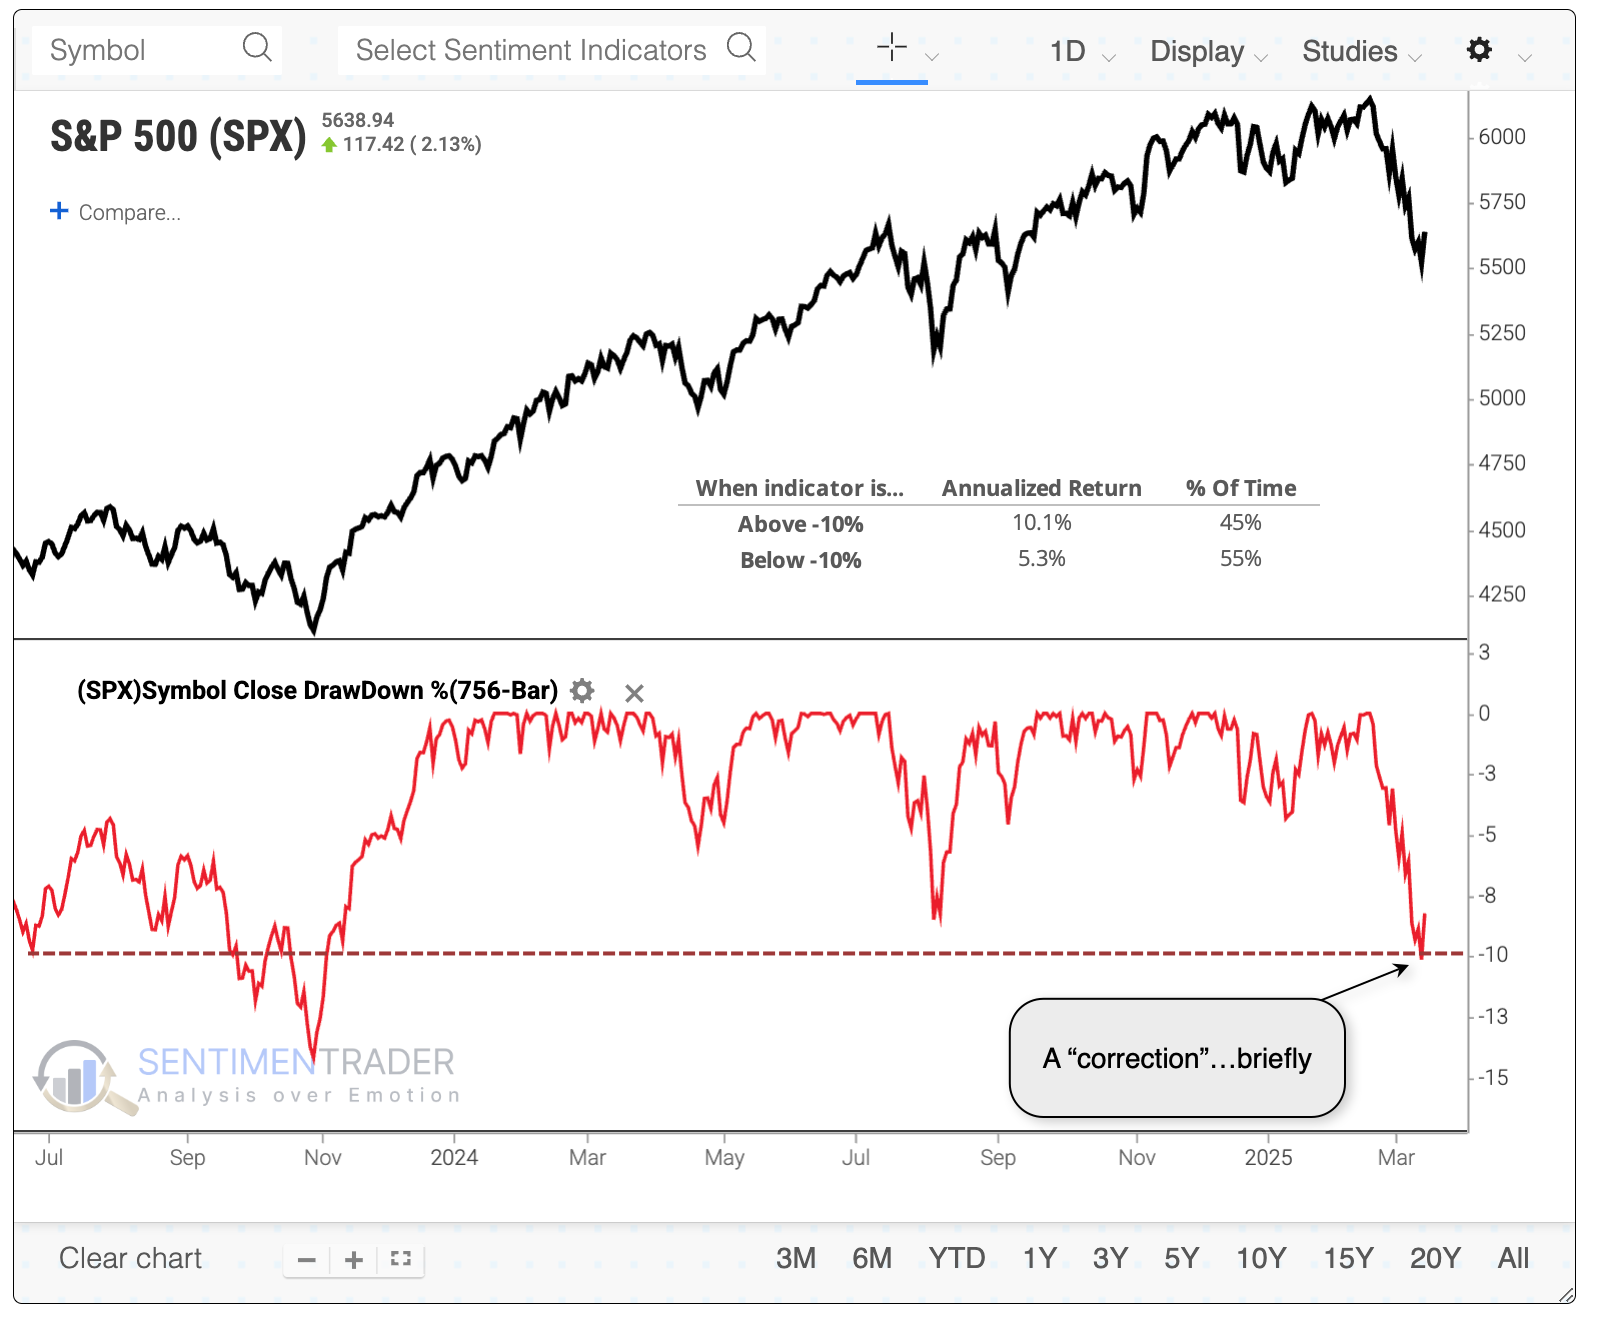
The whole world knows by now that the most benchmarked equity index in the world, the S&P 500, fell into a correction. Whatever its merits, "correction" is widely accepted as a -10% drawdown from the most recent high close.
So far, the feared correction lasted all of one session. That's a good thing, too - we can see below that the S&P's annualized return gets cut by about half when it is 10% or more from its most recent multi-year high.
Most of us are interested in whether this correction is likely to morph into a bear market. Again, we'll use the accepted shorthand here of using a -20% drawdown from a high, or at least another -10% from the correction date.
The pessimistic case
The chart below shows every time the S&P corrected -10% from a multi-year high within 65 sessions. That's on the quicker side as corrections go. For this chart, we're only focused on those that fell into bear markets, losing at least another -10% within the following year.
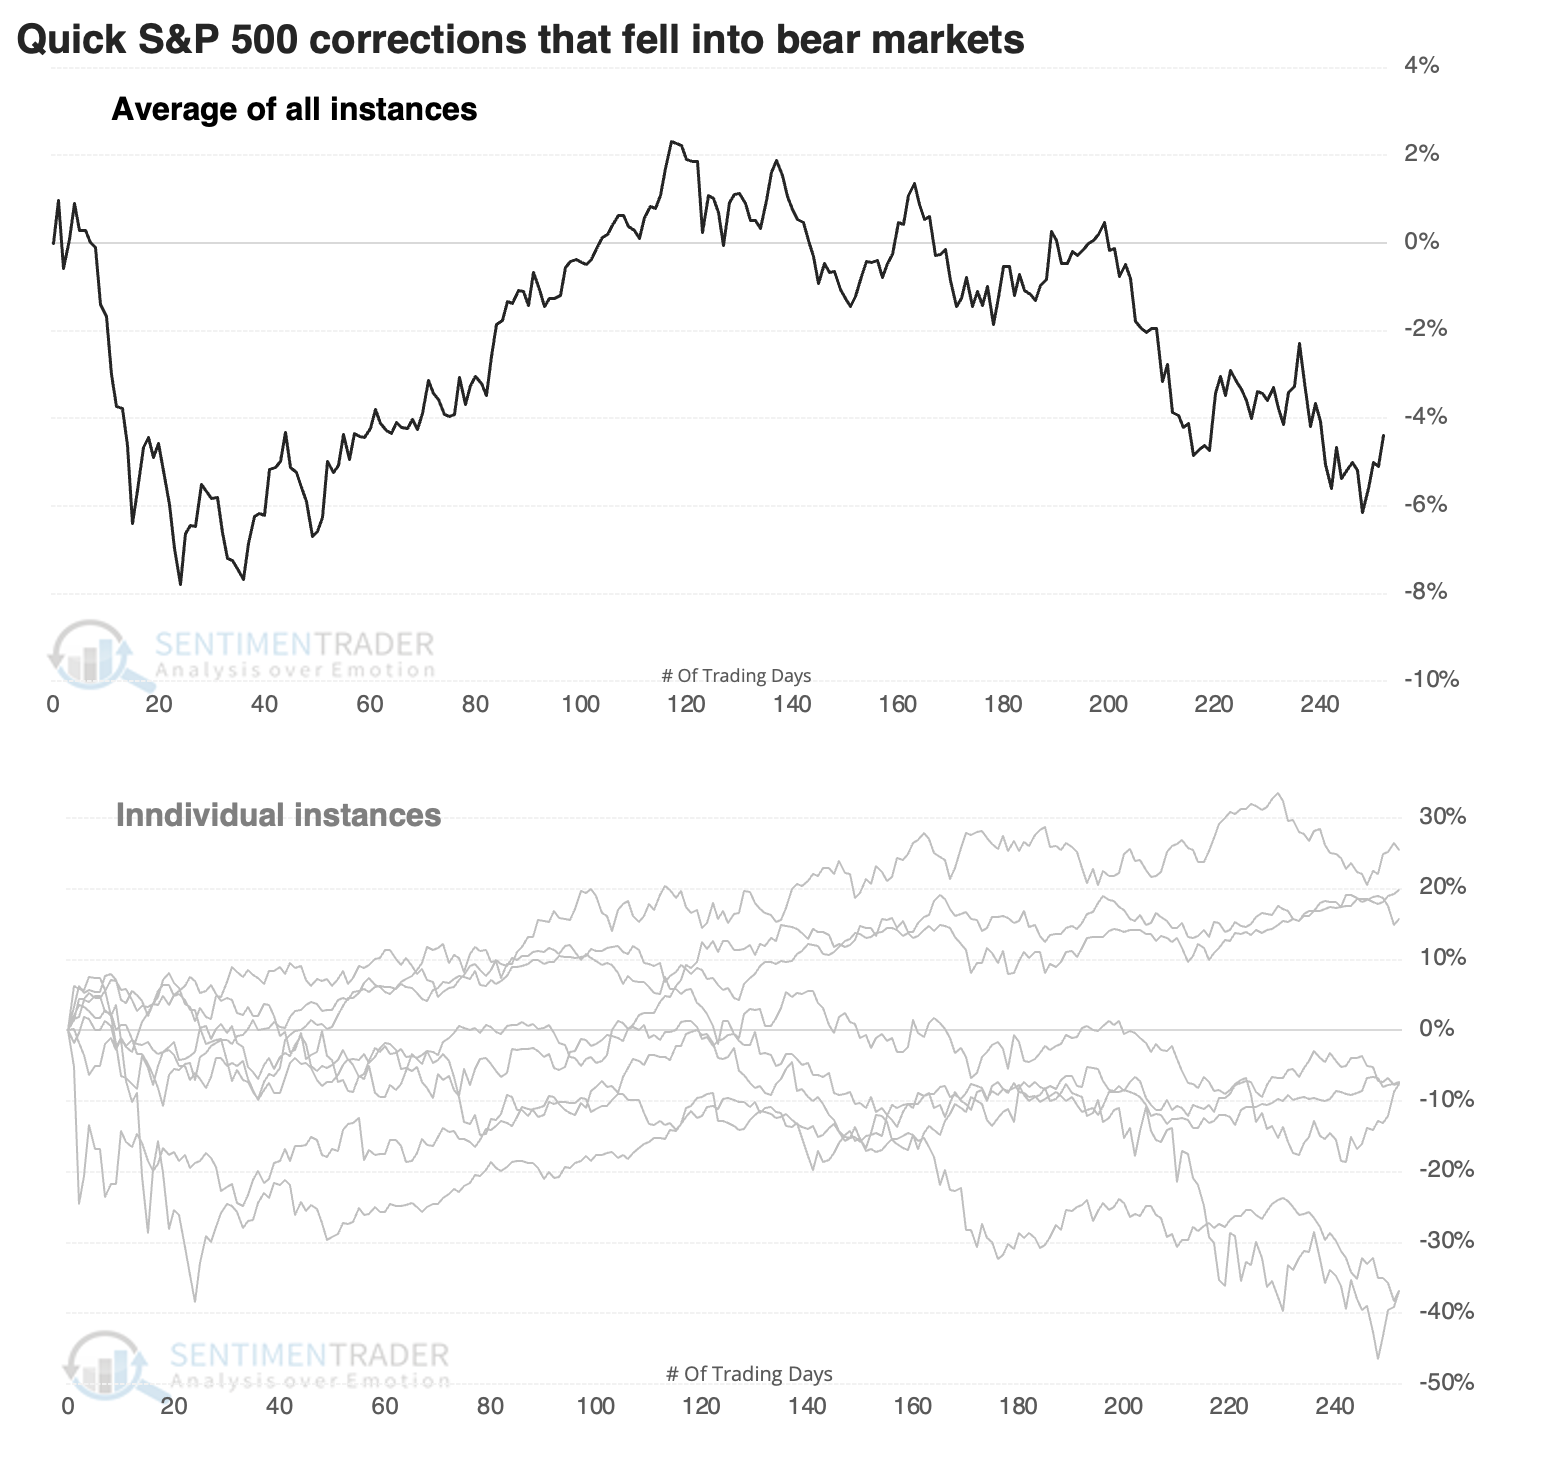
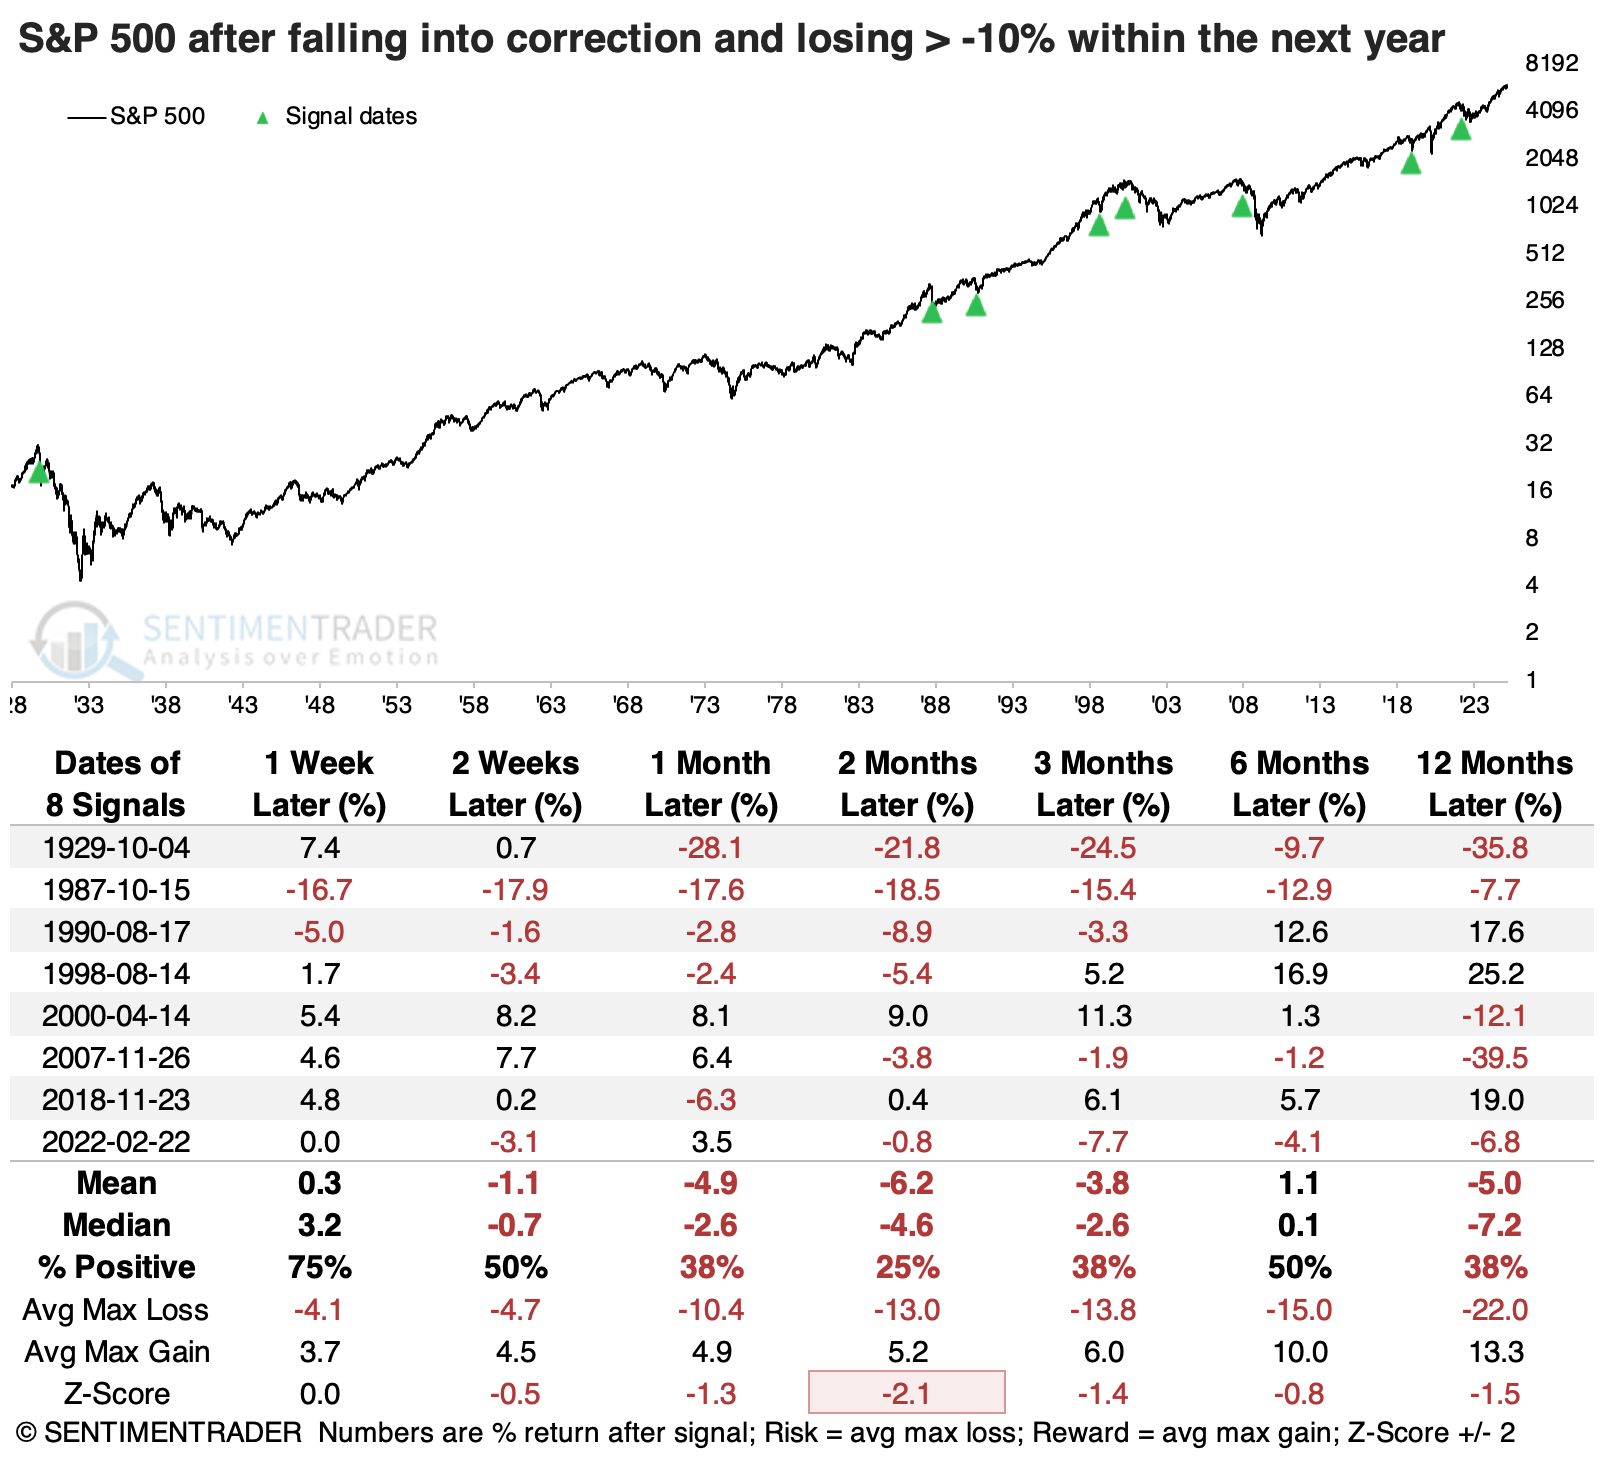
The table below puts some numbers to the losses. As expected, there is a lot of red, by definition. Several of them saw impressive rebounds nearly immediately, but they quickly failed, with most of them showing negative returns within a month.
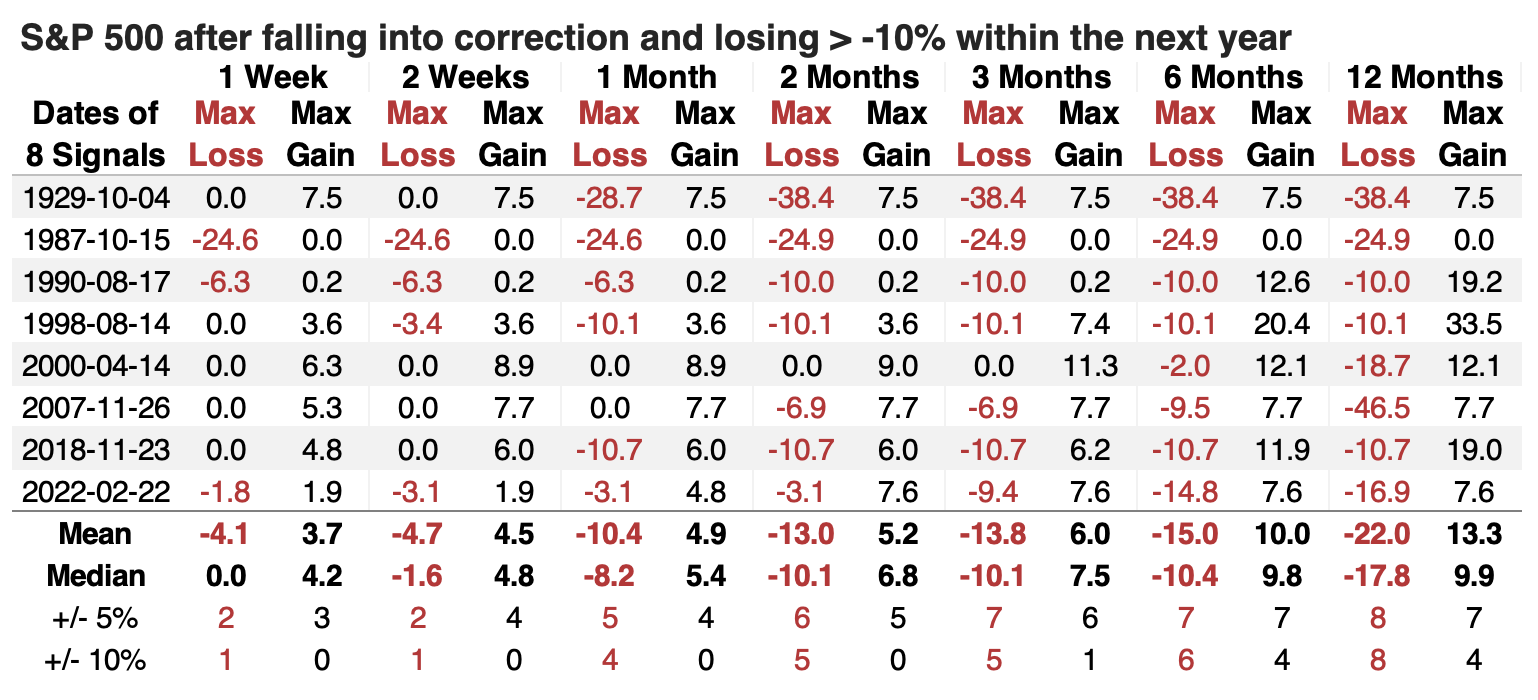
The table of max gains and losses shows that half the instances lost another -10% within the first month after falling into a correction. Even within the next two months, no instance gained more than +10% from the correction point. Most of these were relatively quick, losing more than -5% within the first two months. But they were violent, with some big (failed) rebounds in the interim.
The optimistic case
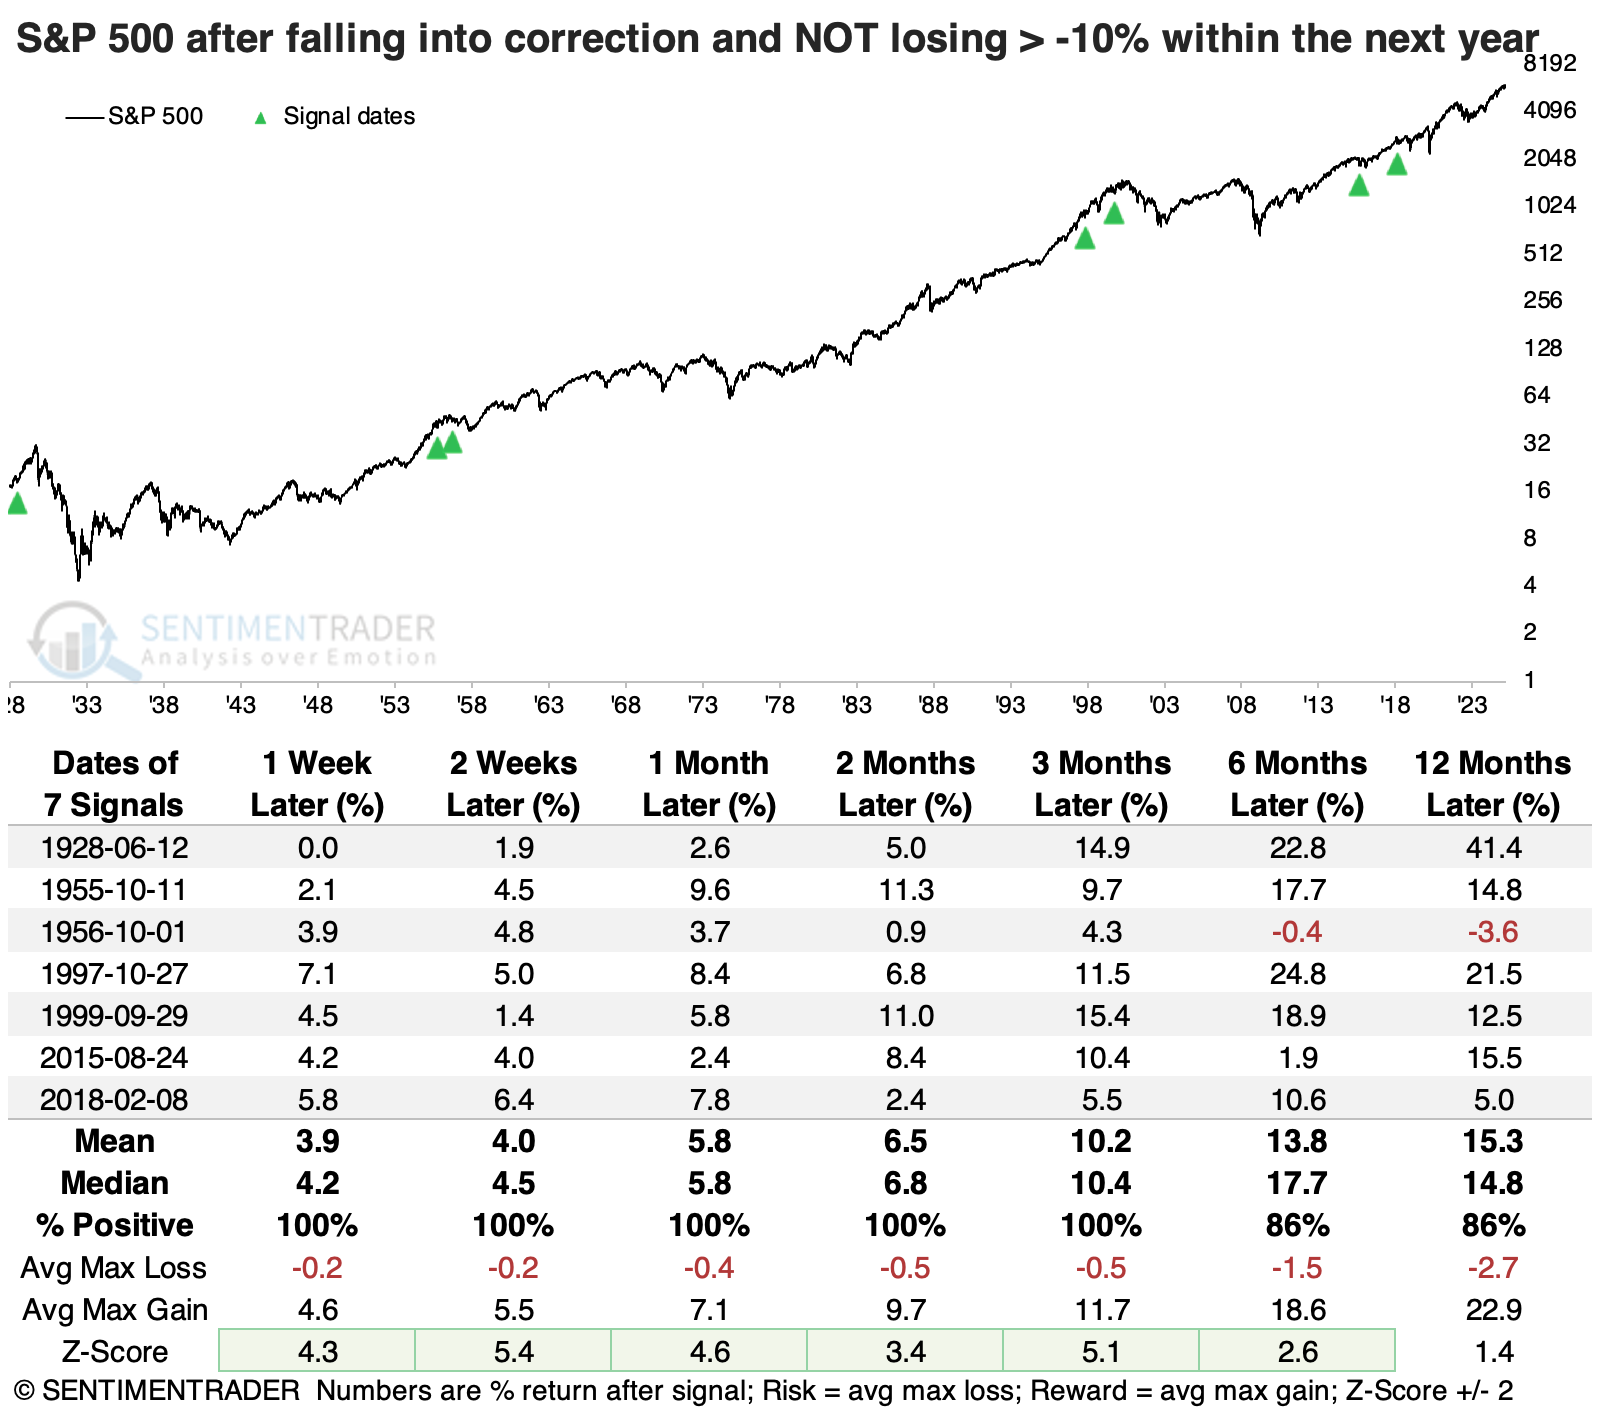
Let's turn to the corrections that bulls hope are most similar to our current instance. These are the corrections that did not morph into bear markets, meaning that the S&P 500 did not fall more than -10% at any point within the following year.
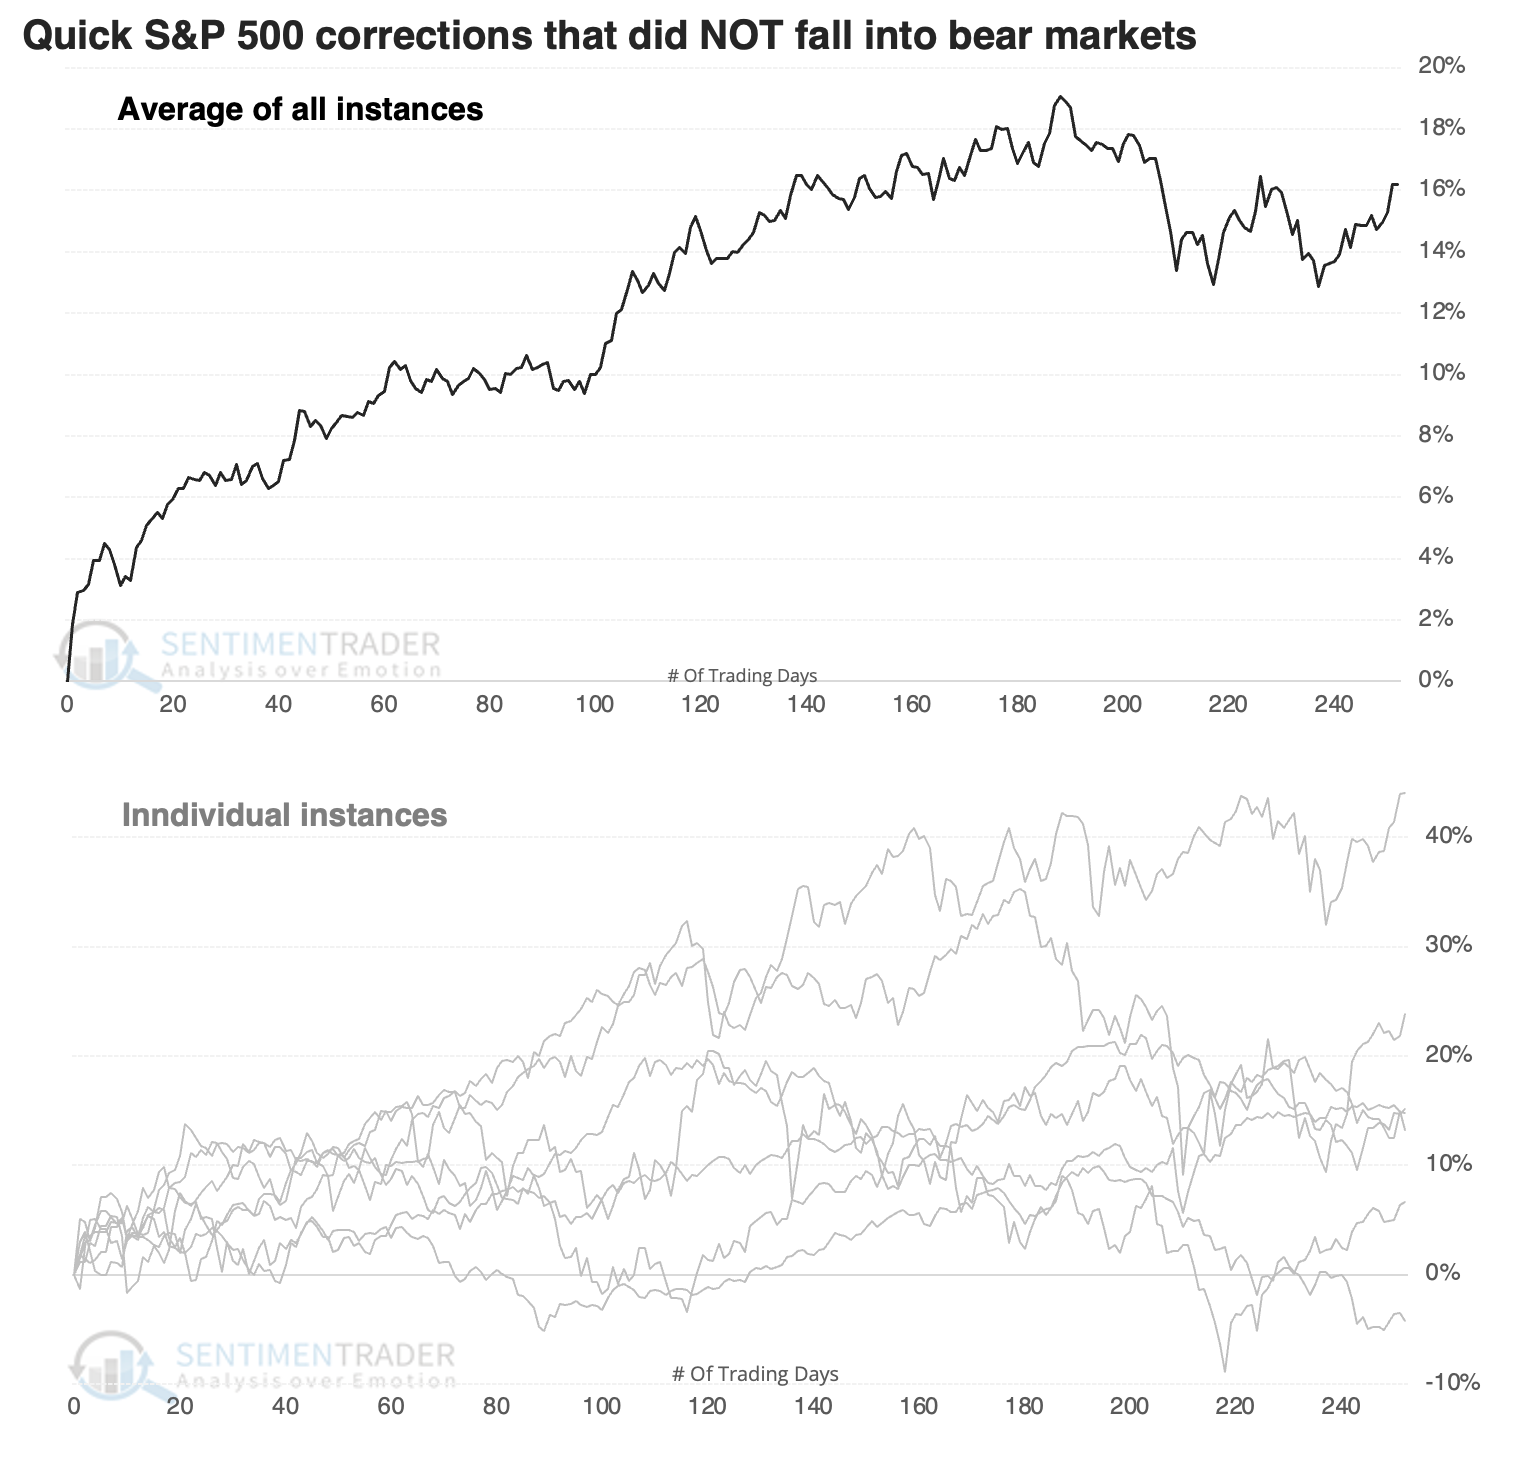
These rebounded quickly, like some of the bear market instances, so that doesn't tell us a lot. But these were also highly consistent, not giving back much, if any, of their gains as the weeks progressed. Most of them continued to build on their gains.
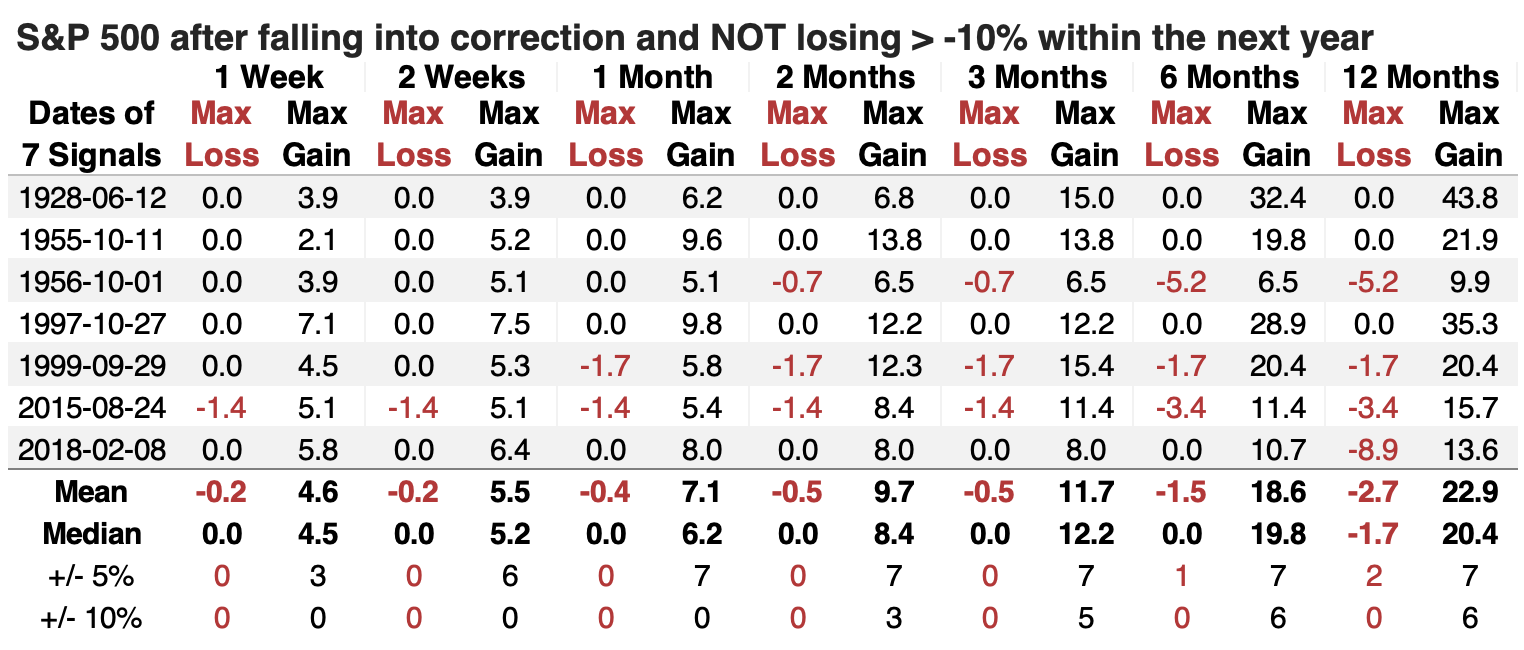
The table of maximum gains and losses shows little downside at any point within the first three months. Not a single instance lost even -5% from the correction point within three months, and all seven of them gained at least +5%.
Which is most likely?
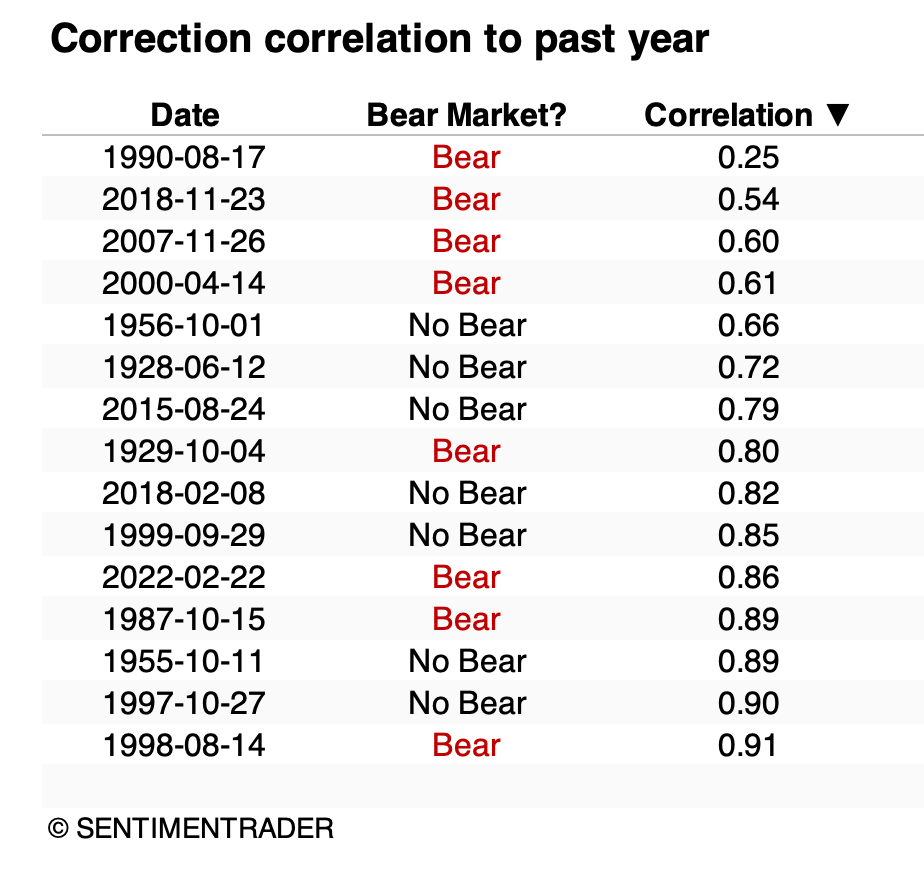
Well, that depends on a million different fundamental, economic, geopolitical, structural, and technical factors. But if we look at each correction's price correlation to the S&P 500 over the past year, maybe we can glean a hint.
The table below shows each correction's correlation to the price action since March 2024, sorted by the least correlated to the most. It's perhaps notable that of the four times the S&P 500 acted least like it did over the past year, the index fell into a bear market. The most-correlated years didn't show any consistent pattern - two of the three most-correlated did not fall into a bear market, but only six of the ten most-correlated did not, just a 60% probability.
What the research tells us...
It's maybe some good news that given how the S&P 500 has performed over the past year, it's a bit less likely it may fall another -10% within the next year. The least-correlated years had a better chance of seeing weak price action.
That doesn't give us much information, at least enough to be confident about. The best information will be how traders and investors respond in the weeks ahead. While corrections that morphed into bear markets had some violent rebounds, they tended to fail pretty quickly. The ones that did not fall into bear markets saw nearly immediate - and persistent - buying interest. There were few losses at any point from when the S&P initially fell into the correction threshold.