Data &
Technology
Research
Reports
Report Solutions
Reports Library
Actionable
Strategies
Free
Resources
Simple Backtest Calculator
Simple Seasonality Calculator
The Kelly Criterion Calculator
Sentiment Geo Map
Public Research Reports
Free Webinar
Pricing
Company
About
Meet Our Team
In the News
Testimonials
Client Success Stories
Contact
Log inLoginSign up
< BACK TO ALL REPORTS

S&P 1500 Index constituents flash an oversold signal

Jay Kaeppel
2023-08-31
On a recent day, not a single stock in the S&P 1500 Index showed a 14-day RSI reading above 70%. Intuitively, this seems like a warning sign of broad market weakness. However, historical results tend to suggest something else.

Key points

  • At the risk of sounding like a broken record, individual objective indicators continue to flash "oversold in an uptrend" signals
  • The S&P 1500 RSI 14-day > 70 indicator just flashed on an oversold signal
  • This signal has generally benefitted both short-term traders and long-term investors in the past

% S&P 1500 RSI 14-day > 70 drops to 0

As the name implies, the % S&P 1500 RSI 14-day > 70 indicator measures the percentage of stocks that comprise the S&P 1500 Index that presently sport a 14-day RSI reading above 70. The chart below displays all days when this indicator stood at 0% - i.e., not a single stock among the S&P 1500 constituents showed a 14-day RSI reading above 70.

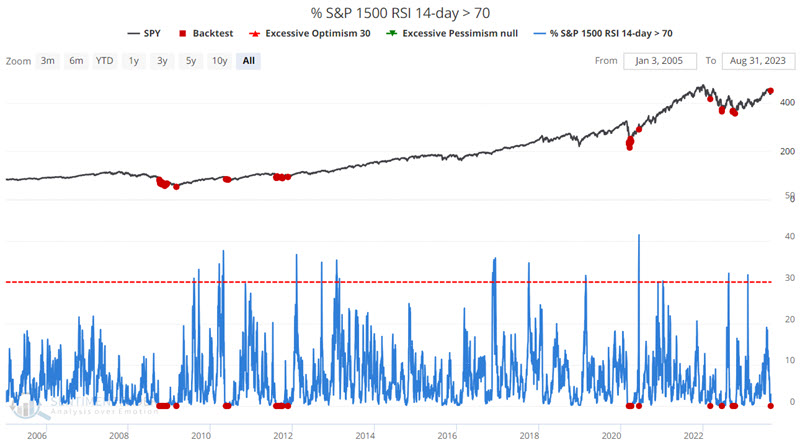
The table below summarizes SPX performance following these days.

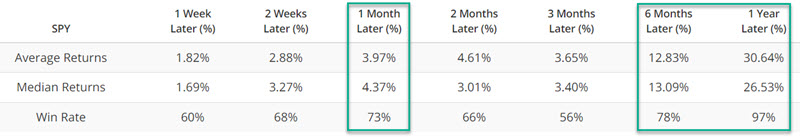
Overall results are favorable; however, these signals can be early if the market is in the middle of a more drawn-out decline. 

Alternative interpretations

One alternative is waiting for this indicator value to rise above 0. The chart below displays all days when this indicator rose above 0% after first touching 0%, and the table summarizes SPX performance. 

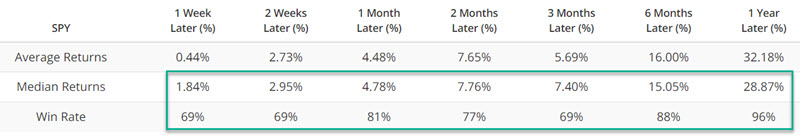
Overall, the results are better virtually across the board, but not by a lot, and a continuation of a given decline can occur, as seen in 2008, 2011, and 2020. Still, either of the signals above generally serve as:

  • An alert to short-term traders to look for a buying opportunity
  • A signal for long-term investors to consider putting cash on the sidelines to work in the market

To illustrate this opinion, consider results if we exclude signals that occur within three months of a previous signal. The chart below displays those times when the indicator fell to 0% for the first time in three months.

The tables below display SPX performance. Note the relatively high Win Rates from 1 month to 1 year. On the other hand, note also that the October 2008 signal is a reminder that no signal is ever perfect, and traders are never relieved of their responsibility to manage risk.

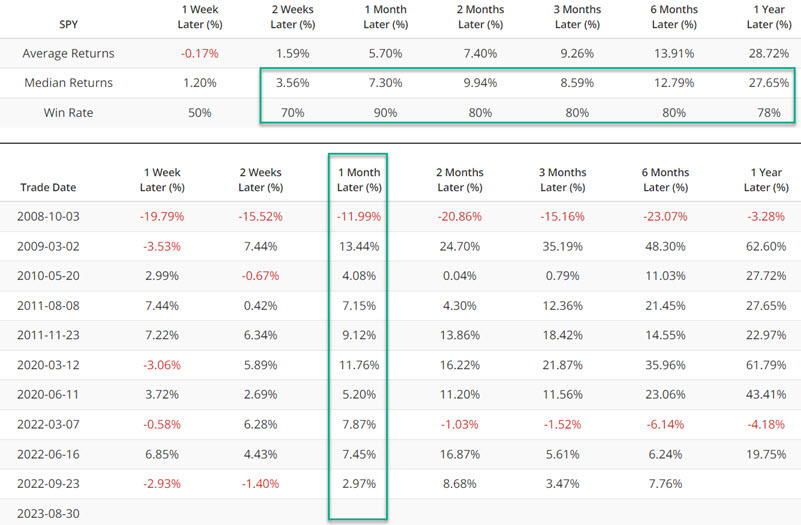
1-month results have historically been well above average. However, given that September has a history of being the weakest month of the year, it will be interesting to see how the market reacts to the 2023-08-30 signal in the month ahead.

What the research tells us…

As always, no single indicator should be considered as the "be all, end all" for trading purposes. And to repeat, no matter the historical track record of any indicator, individual investors and traders are never relieved of their responsibility to allocate capital wisely and manage risk ruthlessly. That said, the signals from the % S&P 1500 RSI 14-day > 70 indicator highlighted above remind us that pullbacks are a natural occurrence in the market and that alert investors and traders can often take advantage of these pullbacks as opportunities to put money to work.

Sorry, you don't have access to this report

Upgrade your subscription plan to get access
Go to Dasboard
DATA &
TECHnologies
IndicatorEdge
‍
BackTestEdge
‍
Other Tools
‍
DataEdge API
RESEARCH
reports
Research Solution
‍
Reports Library
‍
actionable
Strategies
Trading Strategies
‍
Smart Stock Scanner
‍
FREE
RESOUrCES
Simple Backtest
Calculator
Simple Seasonality
Calculator
The Kelly Criterion
Calculator
Sentiment Geo Map
‍
Public Research Reports
‍
Free Webinar
COMPANY
‍
About
‍
Meet our Team
‍
In the News
‍
Testimonials
‍
Client Success Stories
Pricing
Bundle pricing
‍
Announcements
‍
FAQ
© 2024 Sundial Capital Research Inc. All rights reserved.
Setsail Marketing
TermsPrivacyAffiliate Program
Risk Disclosure: Futures and forex trading contains substantial risk and is not for every investor. An investor could potentially lose all or more than the initial investment. Risk capital is money that can be lost without jeopardizing ones’ financial security or life style. Only risk capital should be used for trading and only those with sufficient risk capital should consider trading. Past performance is not necessarily indicative of future results.

Hypothetical Performance Disclosure: Hypothetical performance results have many inherent limitations, some of which are described below. No representation is being made that any account will or is likely to achieve profits or losses similar to those shown; in fact, there are frequently sharp differences between hypothetical performance results and the actual results subsequently achieved by any particular trading program. One of the limitations of hypothetical performance results is that they are generally prepared with the benefit of hindsight. In addition, hypothetical trading does not involve financial risk, and no hypothetical trading record can completely account for the impact of financial risk of actual trading. for example, the ability to withstand losses or to adhere to a particular trading program in spite of trading losses are material points which can also adversely affect actual trading results. There are numerous other factors related to the markets in general or to the implementation of any specific trading program which cannot be fully accounted for in the preparation of hypothetical performance results and all which can adversely affect trading results.

Testimonial Disclosure: Testimonials appearing on this website may not be representative of other clients or customers and is not a guarantee of future performance or success.